Intelinair is an imagery and analytics provider helping you prioritize acres through regular alerts and reporting.
OUR FOCUS AREAS
AGRONOMIC FIELD INSIGHTS AND ANALYZE
Confidently cover your acres through in-season scalable Insights covering key production variables, including stands, weeds, crop health, and more. Analyze, AGMRI’s postseason analytics, will inform next year’s decisions through unique views and provide insights into potential impacts on yield like emergence, crop input product performance, weather, and other management practices.
FIELD SCOUTING TOOLS
Elevate your scouting program through AGMRI. Efficiently assign, track and share scouting activities throughout the growing season.
NITROGEN MANAGEMENT
Optimize your nitrogen management through our unique offering that offers you the ability to proactively manage your nitrogen needs or monitor nitrogen deficiency to allow you to address before yield loss. Nitrogen management insights are provided throughout the season helping users improve economic and agronomic outcomes.
Our exclusive platform, AGMRI helps user prioritize their management decisions through season-long alerts.
WHAT WE DELIVER
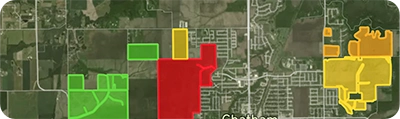
Elevated agronomic management decisions through actionable, broad-acre insights.
Field-level views, at scale, thanks to high-resolution imagery.
Agronomic analytics to pinpoint priority areas.
Timely decisions through regular monitoring and results.
Data-backed decision making thanks to historical views.
Postseason analytics suite that identifies potential impacts on yield for next crop year planning.
WHAT WE OFFER
AGMRI Offers for the 2026 Crop Season
Crop intelligence for data-driven decisions—through the season.
Choose the level of insight that fits your operation and your goals.
Understand where your corn yield is based on the current state of the crop. As the season unfolds, see how it is having an impact on your final yield.
Yield Loss
Powered by years of Nitrogen research at the University of Missouri, our corn Yield Loss analytic, powered by NVision Ag, gives insight into potential yield loss due to Nitrogen deficiency. Optional analytic for nitrogen management.
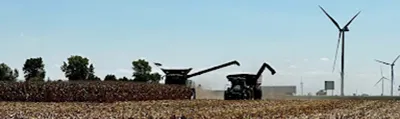
Variable Dry Down
Understand which fields and which areas of the field are drying down to help plan your harvest logistics.
Underperforming Area
Not all areas of your fields perform the same and low NDVI doesn’t necessarily mean there is anything you can do to fix it this year. Underperforming Area alerts you to the fields and areas of the fields that are performing below their historical potential. This will allow you to quickly find those fields and areas and make adjustments to get them back on target and protect yield.
Nutrient Deficiency
As the crop grows, it can tell us more of what is wrong with it. This analytic finds the fields and areas of the fields where there is a nutrient deficiency so that issues can be addressed before grain fill.
Disease Stress
In conjunction with the Thermal Stress, Disease Stress alert takes into account weather information to more precisely indicate the type of stress impacting the crop.
Thermal Stress
Using our thermal imagery, AGMRI can detect elevated heat patterns of the crop that indicate crop stress.
Crop Health
Get a complete view of your farms and fields and identify where yield potential is ranked highest to the lowest.
Weed Map & Weed Escape
Know what fields and areas of the fields have weeds. With machine integration or based on planting date, be alerted to what fields have weeds that may be impacting yield.
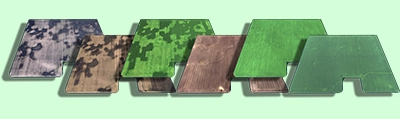
Historical Field Performance
AGMRI creates 5 performance zones in each field based on the historical average of those zones. This data is used to compare the current season to help understand where you are underperforming from the zone potential.
Low Emergence
Notification of what fields and areas of the field have poor emergence.
Stand Assessment
AGMRI detects the established rows and uses computer vision and machine learning to determine the best segment of row and compares the rest of the field to that segment to give you a relative map. If machine data is integrated, a stand population map is returned.
YOUR MESSAGE WAS SENT SUCCESSFULLY!
We have received your inquiry and we’ll be in touch with you soon.