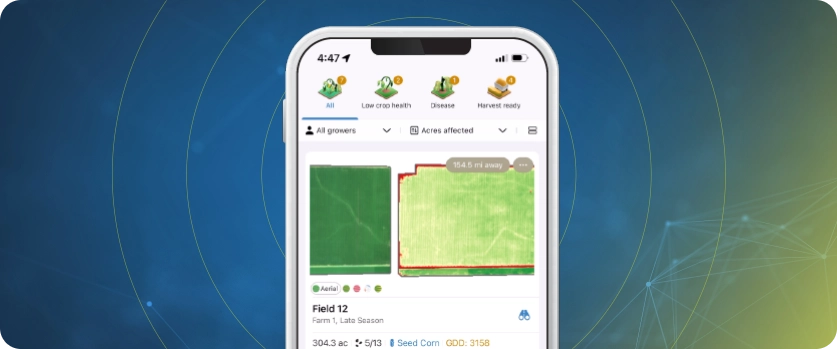
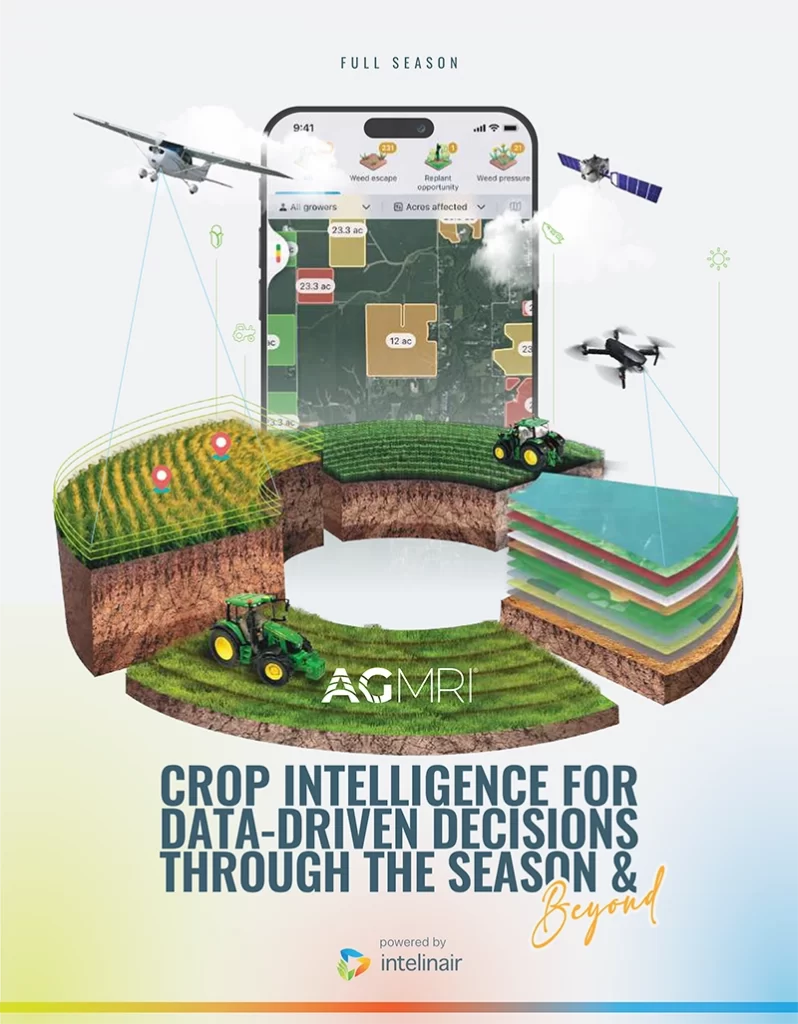
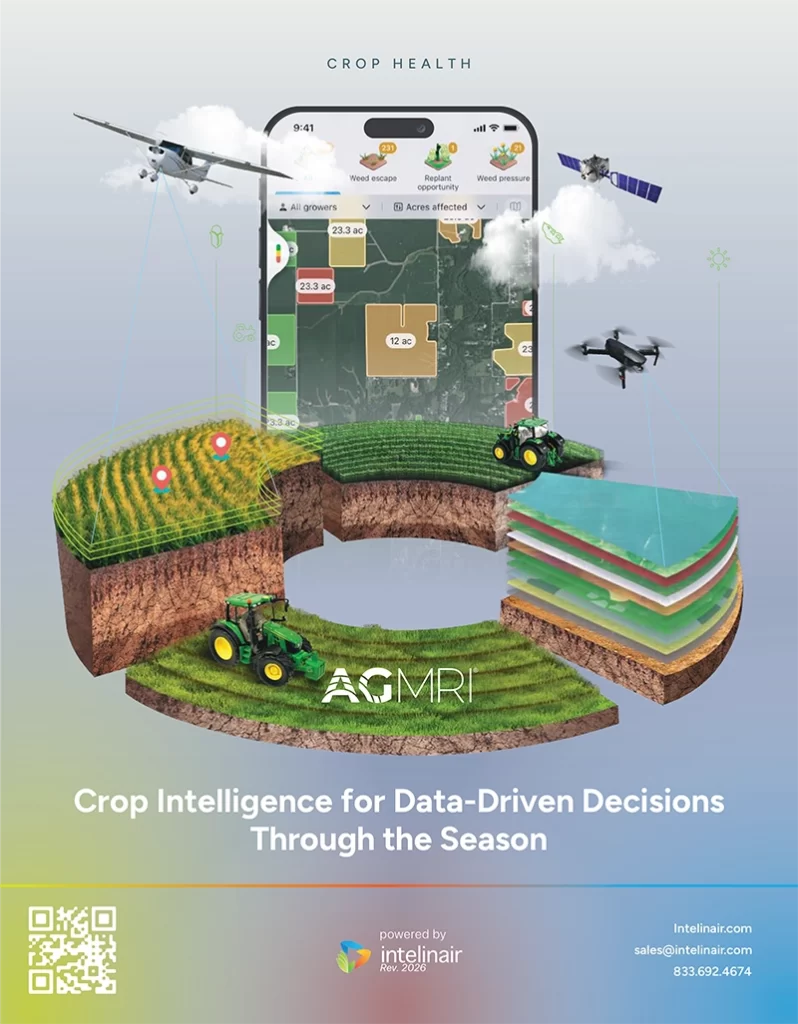
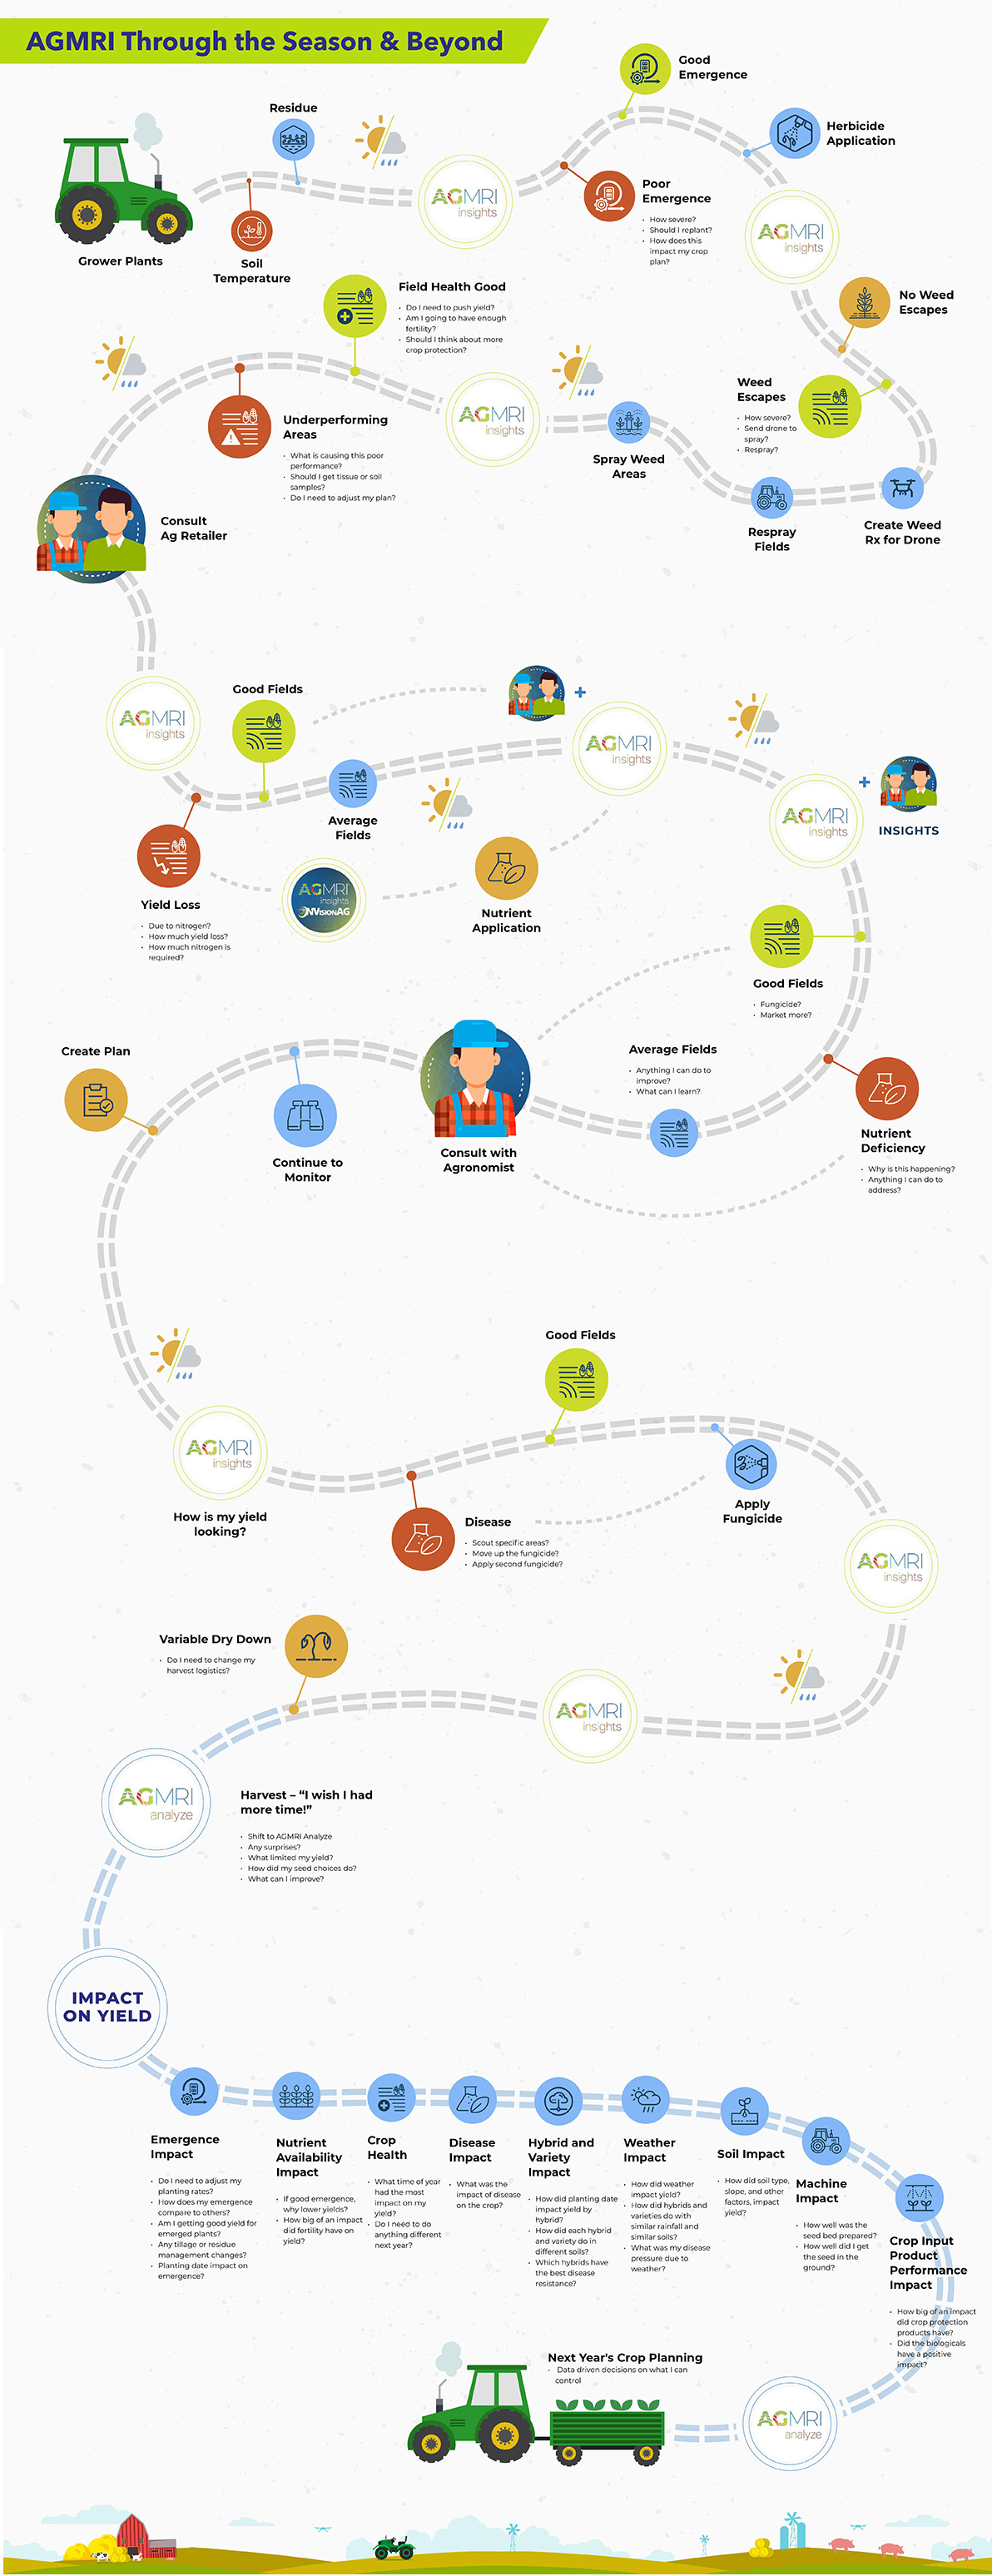
• Identify and quantify emergence differences for Tillage Practices, Hybrids and Varieties, and Planter Practices. Examine factors such as downforce, speed, and more, in order to make farm improvements.
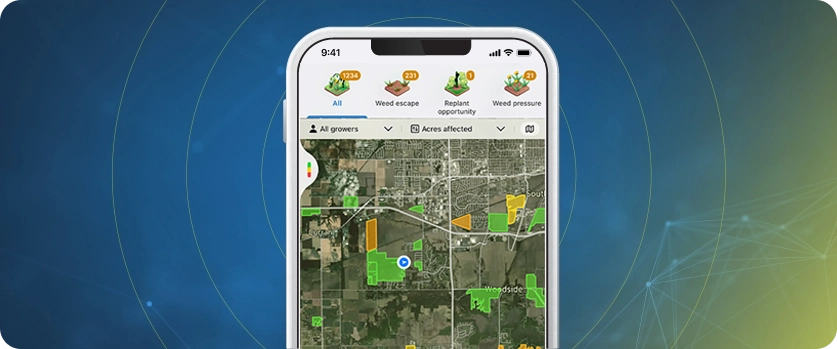
• Identify fields that need replanted, guide operators for replanting, and quantify acres for seed.