Use Case: Monitoring Nitrogen Availability with AGMRI & NVision in Indiana
Background
In Indiana, two brothers farm corn, soybeans, and wheat, and also operate several hog barns. Wheat is included in their rotation in part to support their livestock operation. Their operation reflects typical farming practices: standard field cultivators, VT tools, and conventional planters (not high-speed). Most in-season applications, such as herbicide and fungicide, are handled by their ag retailer partner.
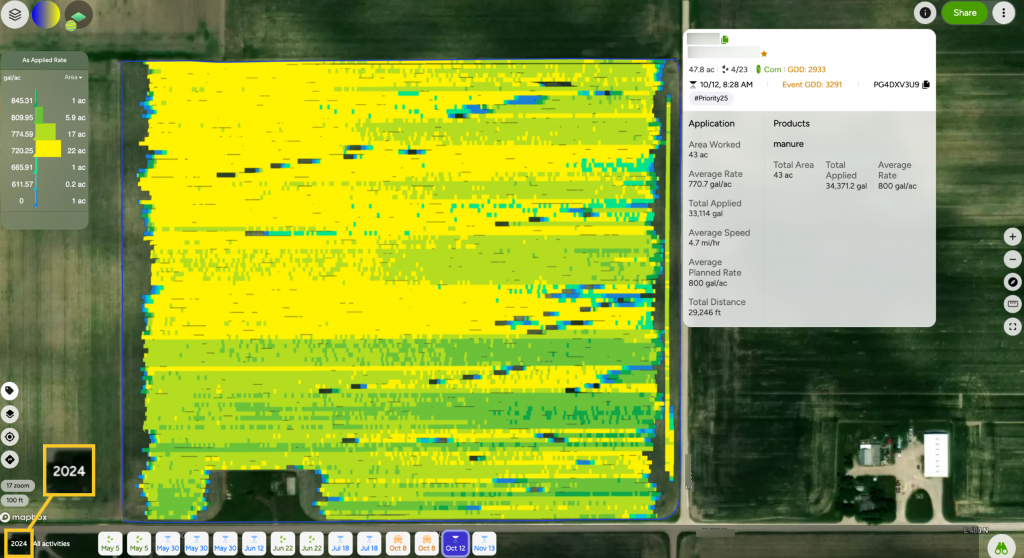
They have been leveraging AGMRI for several years, integrating insights into their decision-making with consistent results. In fall 2024, favorable weather conditions allowed them to apply manure across fields. However, the following spring brought wet weather, followed by dry conditions in the summer—a challenging combination for efficient nitrogen utilization.
Map shows manure application on October 12, 2024.
Challenge
Nitrogen is a critical but costly input for corn production. These growers use manure from their hogs as a primary nitrogen source, supplemented by starter fertilizer at planting. While manure can be highly effective when properly applied and managed, its nutrient content and seasonal availability are not always predictable, especially when fall-applied.
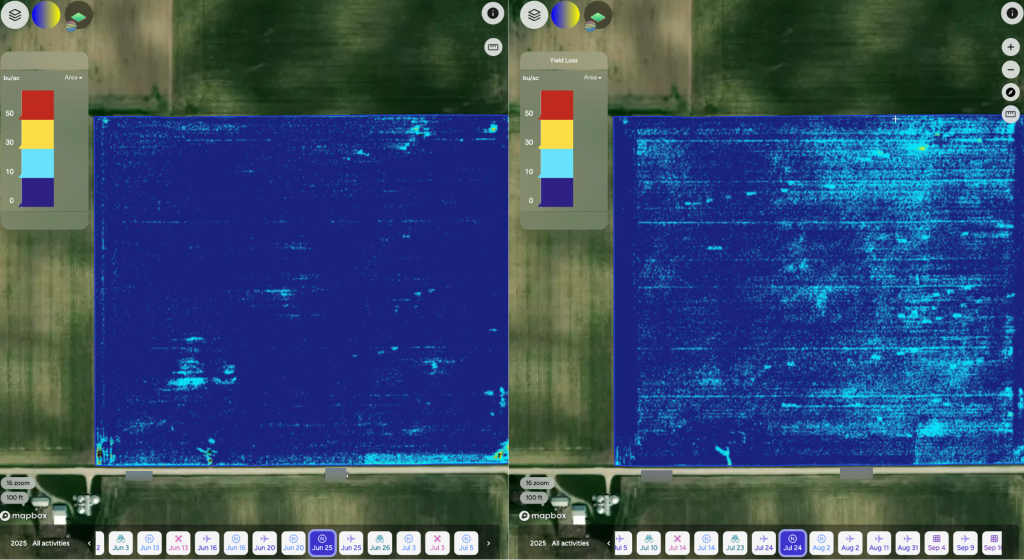
Early in the season, AGMRI’s NVision maps (June 25th) showed adequate nitrogen across the field. But by July 24th, the maps revealed significant nitrogen deficiencies, prompting the question: was starter fertilizer masking issues early on, and had the fall-applied manure already leached beyond the root zone?
Analysis suggested that starter fertilizer supported crop growth until mid-season. Still, the manure nitrogen had either moved out of the soil profile or beyond the reach of the root system. Skipped application zones in the “as-applied” manure map aligned with problem areas in both June and July, confirming the diagnosis.
Without intervention, these deficiencies risked yield losses of 10–30 bushels per acre in affected zones.
NVision maps from June 25 and July 24, 2025 — showing nitrogen loss across the growing season without the use of a stabilizer.
Solution
AGMRI’s NVision map provided real-time visibility into nitrogen dynamics, helping the growers identify and validate where manure nitrogen was failing to sustain the crop. The map confirmed that starter fertilizer had initially masked the problem, but deficiencies became apparent as the season advanced.
To address the issue, the brothers plan to adjust their manure application strategy by incorporating an injection system with a stabilizer into their applicator. This will help maintain nitrogen availability longer and support crop health throughout the season.
Results
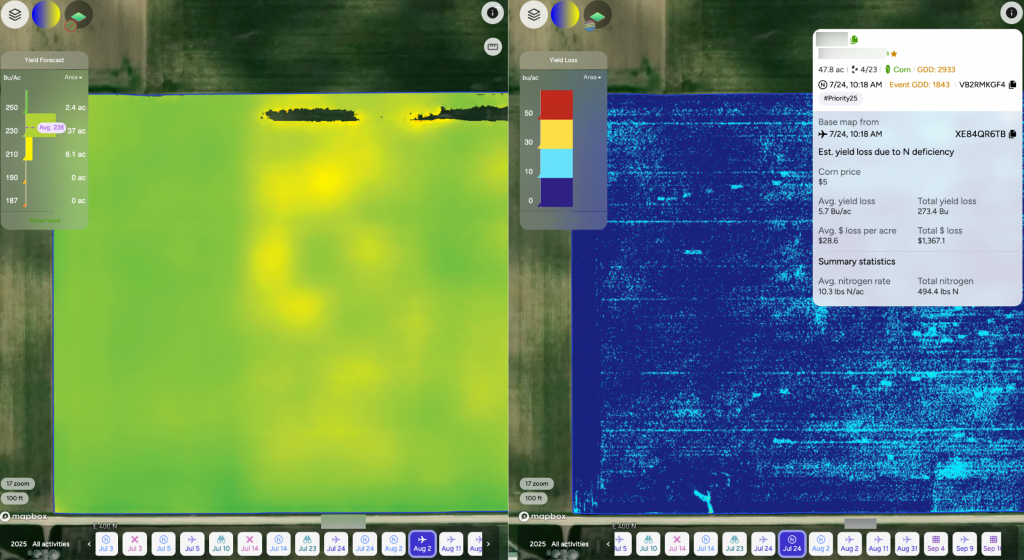
AGMRI’s Yield Forecast map on August 2 revealed a clear correlation: nitrogen-deficient areas were forecasted around 210 bushels/acre, while healthier zones showed projections near 230 bushels/acre. The projected gap highlights measurable yield drag tied to nitrogen availability.
Going forward, the growers plan to use stabilizers with fall manure applications and continue monitoring with AGMRI to validate nitrogen management decisions. With the confidence of real-time data on their nitrogen performance, they can address nutrient issues before they create significant yield losses.
August 2 Yield Forecast map indicating approximately 210 bu/ac in nitrogen-deficient zones and 230 bu/ac in the healthier areas of the field.
Understand where your corn yield is based on the current state of the crop. As the season unfolds, see how it is having an impact on your final yield.
Yield Loss
Powered by years of Nitrogen research at the University of Missouri, our corn Yield Loss analytic, powered by NVision Ag, gives insight into potential yield loss due to Nitrogen deficiency. Optional analytic for nitrogen management.
Variable Dry Down
Understand which fields and which areas of the field are drying down to help plan your harvest logistics.
Underperforming Area
Not all areas of your fields perform the same and low NDVI doesn’t necessarily mean there is anything you can do to fix it this year. Underperforming Area alerts you to the fields and areas of the fields that are performing below their historical potential. This will allow you to quickly find those fields and areas and make adjustments to get them back on target and protect yield.
Nutrient Deficiency
As the crop grows, it can tell us more of what is wrong with it. This analytic finds the fields and areas of the fields where there is a nutrient deficiency so that issues can be addressed before grain fill.
Disease Stress
In conjunction with the Thermal Stress, Disease Stress alert takes into account weather information to more precisely indicate the type of stress impacting the crop.
Thermal Stress
Using our thermal imagery, AGMRI can detect elevated heat patterns of the crop that indicate crop stress.
Crop Health
Get a complete view of your farms and fields and identify where yield potential is ranked highest to the lowest.
Weed Map & Weed Escape
Know what fields and areas of the fields have weeds. With machine integration or based on planting date, be alerted to what fields have weeds that may be impacting yield.
Historical Field Performance
AGMRI creates 5 performance zones in each field based on the historical average of those zones. This data is used to compare the current season to help understand where you are underperforming from the zone potential.
Low Emergence
Notification of what fields and areas of the field have poor emergence.
Stand Assessment
AGMRI detects the established rows and uses computer vision and machine learning to determine the best segment of row and compares the rest of the field to that segment to give you a relative map. If machine data is integrated, a stand population map is returned.
YOUR MESSAGE WAS SENT SUCCESSFULLY!
We have received your inquiry and we’ll be in touch with you soon.