Use Case: Identifying and Quantifying Tillage Impact on Crop Emergence with AGMRI
Background
A grower in North Central Indiana manages a large farming operation focused on maximizing yield and efficiency through data-driven decisions. Over time, it has become increasingly difficult for him to find meaningful yield gains—smaller issues are harder to identify and correct.
In his search for improvement, he turned to AGMRI to better understand field performance. His main goal is to ensure early-season crop health and strong nutrient uptake, setting the stage for optimal grain production.
The spring season presented unusual challenges with highly variable weather patterns. Extended wet periods followed by short dry windows created logistical strain. Pressed by timing, he planted some fields earlier than ideal, into soils that were not completely fit—raising concerns about stand uniformity and potential yield impact.
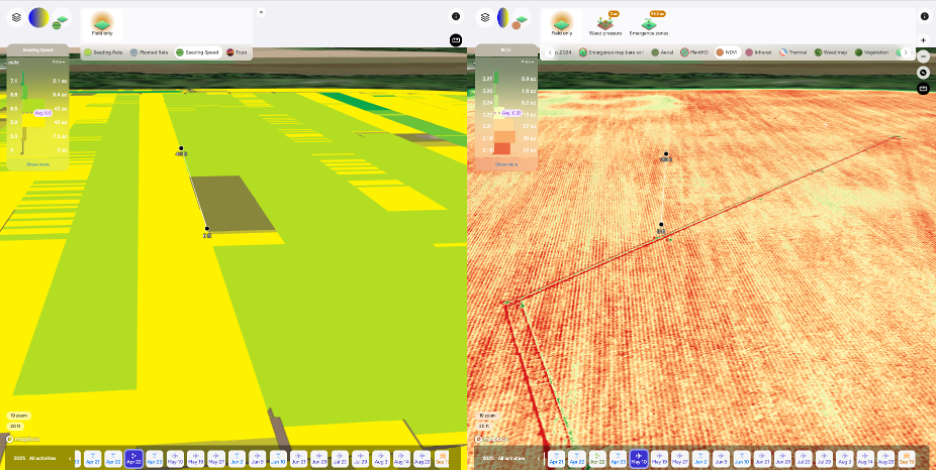
Two different angles on a field– one is the planting angle, and the other is the fall tillage pass.
Challenge Because of weather delays and the size of his operation, the grower was forced to plant before all fields were optimally prepared. Some fields received a full tillage pass in both fall and spring, while others missed part of this process. This inconsistency resulted in tougher seedbeds and variable planting conditions.
He began to question whether the decision to plant under less-than-ideal conditions would have lasting effects. His primary concerns centered on emergence uniformity, stand consistency, and potential yield loss. Without accurate data, it was difficult to assess whether early planting under these conditions was the right call—or an expensive mistake.
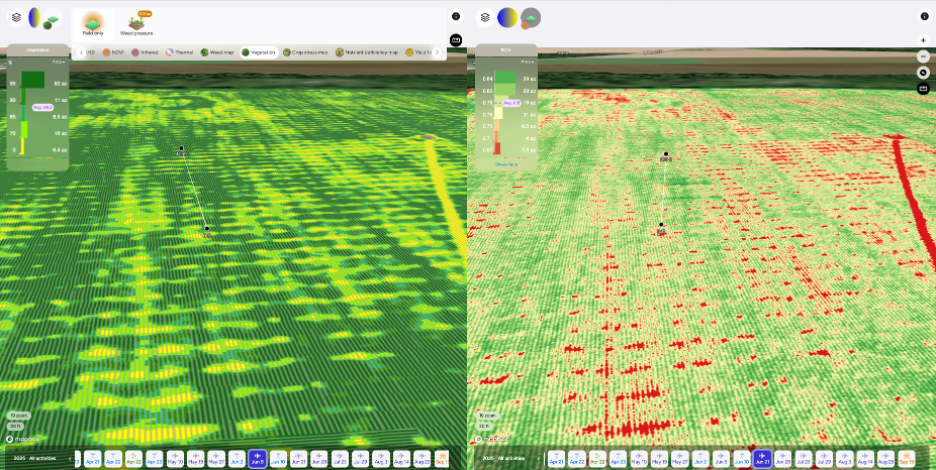
VEG and NDVI showing uneven plants late into the season (June 21)
Solution
Using AGMRI imagery, the grower and his advisor analyzed multiple data layers, including VEG, NDVI, and Aerial imagery, to visualize canopy development patterns. These maps revealed persistent streaking patterns that aligned with the previous fall tillage direction, indicating that the planter was disrupted by these soil inconsistencies—causing uneven seed placement and variable emergence.
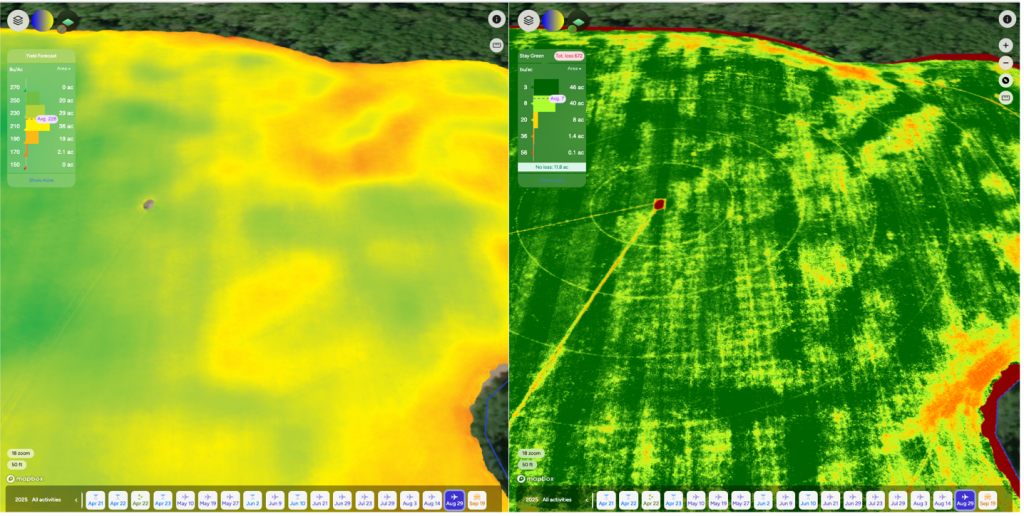
To quantify the agronomic and financial impact, they used Yield Forecast and Stay Green layers. These insights suggested an average yield loss of approximately seven bu/ac, directly correlated with the uneven stand detected earlier in the season.
With this data, the grower was able to validate his suspicions and identify actionable changes for future crop seasons.
Results
The grower now plans to adjust fall tillage strategies, potentially softening the tillage angle or implementing residue management products to reduce soil disruption. This case underscored the importance of aligning tillage practices with spring field conditions.
By quantifying a potential $28-per-acre loss, the grower gained valuable insight into how subtle management differences can significantly affect yield. Going forward, AGMRI will continue to be part of his operation’s monitoring system—helping prioritize field actions and validate management decisions in real time.
Yield Forecast and Staygreen illustrate the loss in late August
Understand where your corn yield is based on the current state of the crop. As the season unfolds, see how it is having an impact on your final yield.
Yield Loss
Powered by years of Nitrogen research at the University of Missouri, our corn Yield Loss analytic, powered by NVision Ag, gives insight into potential yield loss due to Nitrogen deficiency. Optional analytic for nitrogen management.
Variable Dry Down
Understand which fields and which areas of the field are drying down to help plan your harvest logistics.
Underperforming Area
Not all areas of your fields perform the same and low NDVI doesn’t necessarily mean there is anything you can do to fix it this year. Underperforming Area alerts you to the fields and areas of the fields that are performing below their historical potential. This will allow you to quickly find those fields and areas and make adjustments to get them back on target and protect yield.
Nutrient Deficiency
As the crop grows, it can tell us more of what is wrong with it. This analytic finds the fields and areas of the fields where there is a nutrient deficiency so that issues can be addressed before grain fill.
Disease Stress
In conjunction with the Thermal Stress, Disease Stress alert takes into account weather information to more precisely indicate the type of stress impacting the crop.
Thermal Stress
Using our thermal imagery, AGMRI can detect elevated heat patterns of the crop that indicate crop stress.
Crop Health
Get a complete view of your farms and fields and identify where yield potential is ranked highest to the lowest.
Weed Map & Weed Escape
Know what fields and areas of the fields have weeds. With machine integration or based on planting date, be alerted to what fields have weeds that may be impacting yield.
Historical Field Performance
AGMRI creates 5 performance zones in each field based on the historical average of those zones. This data is used to compare the current season to help understand where you are underperforming from the zone potential.
Low Emergence
Notification of what fields and areas of the field have poor emergence.
Stand Assessment
AGMRI detects the established rows and uses computer vision and machine learning to determine the best segment of row and compares the rest of the field to that segment to give you a relative map. If machine data is integrated, a stand population map is returned.
YOUR MESSAGE WAS SENT SUCCESSFULLY!
We have received your inquiry and we’ll be in touch with you soon.