dots-horizontal

AGMRI Uncovers Application Error, Helping Illinois Grower Address Sulfur Deficiency

Background

An Illinois grower, along with his crop specialist, was reviewing field conditions during a meeting to assess crop health following a recent tornado in the area. While initially focused on potential weather-related damage, the team noticed a distinct pattern across one of the fields that did not align with storm impacts.

The pattern’s shape suggested an application issue rather than weather effects. By reviewing application maps alongside AGMRI imagery, the team confirmed that the concern was tied to management practices rather than storm damage.

Challenge

The field revealed signs of nutrient stress, specifically sulfur deficiency, linked to a misapplication pattern. If unresolved, this problem posed a significant yield risk—and potentially broader consequences if the equipment malfunctioned across multiple fields.

The grower was concerned about nutrient deficiencies and wanted to understand whether the issue was isolated or systemic. Without corrective action, continued deficiencies could reduce profitability, carry forward into future seasons, and complicate management decisions.

Solution

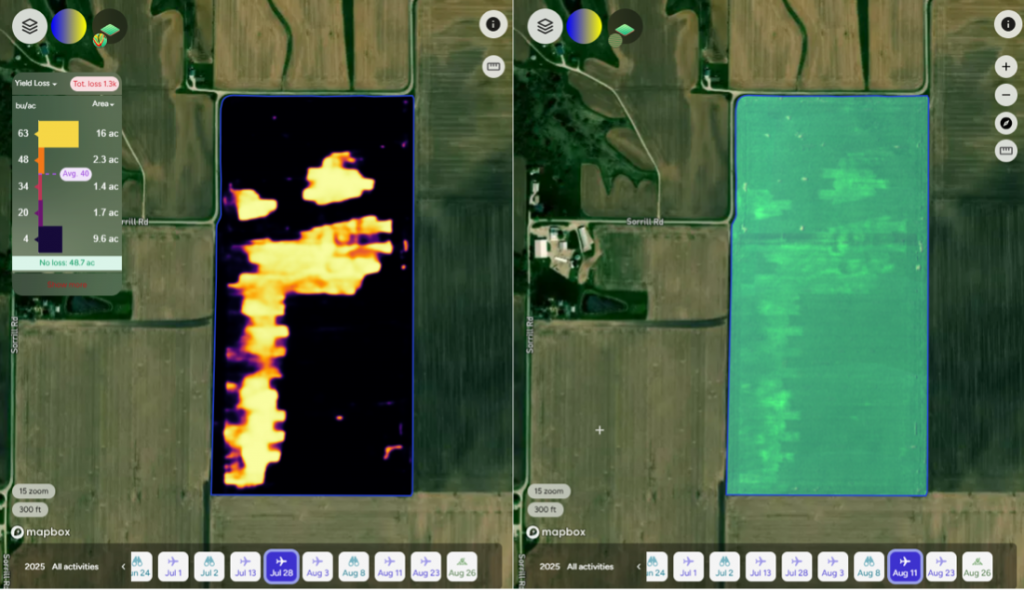
AGMRI imagery played a pivotal role in diagnosing the issue. The color image immediately revealed irregularities in the field pattern, while the nutrient deficiency layer helped map and confirm the affected areas clearly.

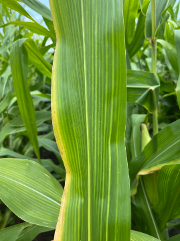
Together, the grower and crop specialist pieced together the story by overlaying AGMRI imagery with application records. This led to the conclusion that a sprayer error had contributed to uneven application, leaving portions of the field under-applied. Scouting validated the diagnosis: the field showed symptoms of sulfur deficiency.

Results

The team identified both the cause and the corrective path forward. The grower now plans to make another targeted application to restore sulfur levels and prevent yield loss. More importantly, catching the issue early prevents the same application problem from spreading across other fields.

This experience reinforced the value of AGMRI imagery not only for identifying weather damage but also for uncovering hidden management issues that might otherwise go unnoticed. With this insight, the grower can prioritize timely nutrient management and avoid future mistakes that could compromise yield potential.

Share This Article

RELATED BLOG POSTS

[pdf-embedder url=”https://www.intelinair.com/wp-content/uploads/2024/10/Topography-Layer.pdf”

Yield Forecast

Understand where your corn yield is based on the current state of the crop. As the season unfolds, see how it is having an impact on your final yield.

Yield Loss

Powered by years of Nitrogen research at the University of Missouri, our corn Yield Loss analytic, powered by NVision Ag, gives insight into potential yield loss due to Nitrogen deficiency. Optional analytic for nitrogen management.

Variable Dry Down

variable dry down

Understand which fields and which areas of the field are drying down to help plan your harvest logistics.

Underperforming Area

low crop health

Not all areas of your fields perform the same and low NDVI doesn’t necessarily mean there is anything you can do to fix it this year. Underperforming Area alerts you to the fields and areas of the fields that are performing below their historical potential. This will allow you to quickly find those fields and areas and make adjustments to get them back on target and protect yield.

Nutrient Deficiency

nutrient deficiency

As the crop grows, it can tell us more of what is wrong with it. This analytic finds the fields and areas of the fields where there is a nutrient deficiency so that issues can be addressed before grain fill.

Disease Stress

disease risk

In conjunction with the Thermal Stress, Disease Stress alert takes into account weather information to more precisely indicate the type of stress impacting the crop.

Thermal Stress

thermal risk

Using our thermal imagery, AGMRI can detect elevated heat patterns of the crop that indicate crop stress.

Crop Health

Crop Health

Get a complete view of your farms and fields and identify where yield potential is ranked highest to the lowest.

Weed Map & Weed Escape

weed escape

Know what fields and areas of the fields have weeds. With machine integration or based on planting date, be alerted to what fields have weeds that may be impacting yield.

Historical Field Performance

AGMRI creates 5 performance zones in each field based on the historical average of those zones. This data is used to compare the current season to help understand where you are underperforming from the zone potential.

Low Emergence

low emergence

Notification of what fields and areas of the field have poor emergence.

Stand Assessment

strand assessment

AGMRI detects the established rows and uses computer vision and machine learning to determine the best segment of row and compares the rest of the field to that segment to give you a relative map. If machine data is integrated, a stand population map is returned.

YOUR MESSAGE WAS SENT SUCCESSFULLY!

dots-horizontal

We have received your inquiry and we’ll be in touch with you soon

Thank you for contacting us.