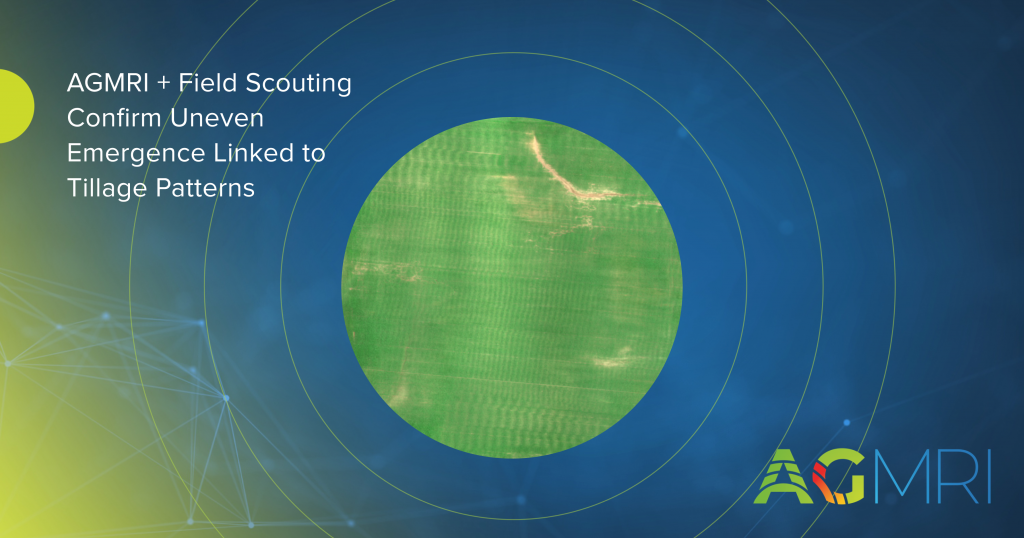
Use Case: AGMRI + Field Scouting Confirm Uneven Emergence Linked to Tillage Patterns
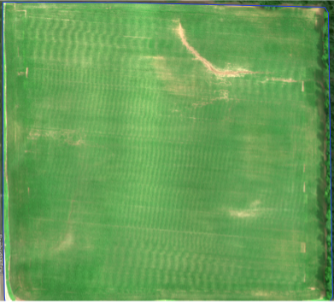
Railroad/wavy pattern moving from NW to SE through the field. Indicates uneven emergence caused by the planter bouncing along the ground due to a poor seedbed.
Background
During a mid-season meeting, an agronomy team and crop specialist reviewed AGMRI imagery across several fields. In one particular field, the imagery revealed a pattern of uneven emergence that caught the team’s attention. The variation appeared in distinct waves, prompting a closer look.
Upon further discussion, the crop specialist noted that the angle of the emergence pattern matched the tillage direction used earlier in the season. The area had also experienced a challenging spring with excessive rainfall, which likely compounded the issue by creating variable soil conditions at planting. Scouting pins placed earlier in the season supported this theory, as several aligned with low-lying areas and poor emergence zones tied to weather stress.
This case presented an opportunity to connect AGMRI maps and related insights with field-level validation to better understand how tillage and weather interactions were affecting stand establishment.
Challenge
The concern was that if the same tillage practices were used across the grower’s entire operation, similar problems could exist in other fields — potentially leading to inconsistent emergence, uneven stands, and reduced yield potential.
While the crop specialist had been somewhat skeptical about the value analytics, this field provided a clear example that could demonstrate how AGMRI helps visualize, verify, and diagnose field variability in real time.
The challenge was twofold: to confirm that the AGMRI maps was accurately detecting the issue, and to identify whether the root cause was tillage-related, weather-related, or a combination of both.
Solution
The agronomy team and crop specialist decided to ground-truth the maps by field scouting the affected fields. After reviewing the NDVI and VEG layers on AGMRI, they observed the same wave-like emergence pattern during the field walk.
The visual alignment between the imagery patterns and tillage direction confirmed that the unevenness seen from above matched what was happening on the ground. The field inspection also showed that wet conditions and compaction from spring rainfall likely amplified the variability.
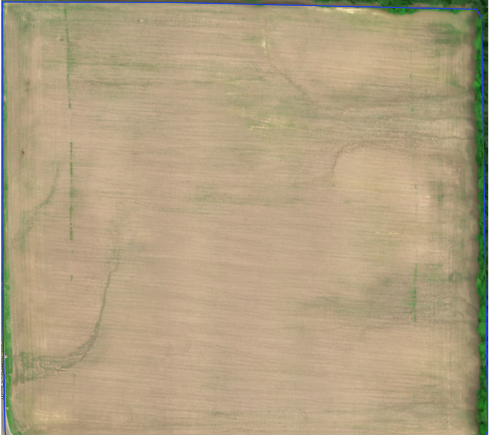
Dirt layer image showing tillage passes from the NW to the SE that correlate with the angle of the train track/wavy pattern.
The crop specialist planned to review the findings with the grower to discuss potential adjustments to tillage methods—such as changing the tillage angle, reducing pass intensity, or incorporating residue management practices—to improve emergence consistency in future seasons.
Results
This collaboration demonstrated how AGMRI’s analytics and field validation can work together to diagnose agronomic issues quickly and accurately. By connecting insights from field scouting, both the agronomist and grower gained a clear understanding of the interactions among tillage patterns, soil conditions, and weather on crop emergence.
The crop specialist expressed greater confidence in using AGMRI for real-time field diagnostics and plans to continue using it to monitor tillage impacts across other fields. Moving forward, the grower will explore refinements to spring tillage practices to minimize soil variability and promote more uniform stands.
Understand where your corn yield is based on the current state of the crop. As the season unfolds, see how it is having an impact on your final yield.
Yield Loss
Powered by years of Nitrogen research at the University of Missouri, our corn Yield Loss analytic, powered by NVision Ag, gives insight into potential yield loss due to Nitrogen deficiency. Optional analytic for nitrogen management.
Variable Dry Down
Understand which fields and which areas of the field are drying down to help plan your harvest logistics.
Underperforming Area
Not all areas of your fields perform the same and low NDVI doesn’t necessarily mean there is anything you can do to fix it this year. Underperforming Area alerts you to the fields and areas of the fields that are performing below their historical potential. This will allow you to quickly find those fields and areas and make adjustments to get them back on target and protect yield.
Nutrient Deficiency
As the crop grows, it can tell us more of what is wrong with it. This analytic finds the fields and areas of the fields where there is a nutrient deficiency so that issues can be addressed before grain fill.
Disease Stress
In conjunction with the Thermal Stress, Disease Stress alert takes into account weather information to more precisely indicate the type of stress impacting the crop.
Thermal Stress
Using our thermal imagery, AGMRI can detect elevated heat patterns of the crop that indicate crop stress.
Crop Health
Get a complete view of your farms and fields and identify where yield potential is ranked highest to the lowest.
Weed Map & Weed Escape
Know what fields and areas of the fields have weeds. With machine integration or based on planting date, be alerted to what fields have weeds that may be impacting yield.
Historical Field Performance
AGMRI creates 5 performance zones in each field based on the historical average of those zones. This data is used to compare the current season to help understand where you are underperforming from the zone potential.
Low Emergence
Notification of what fields and areas of the field have poor emergence.
Stand Assessment
AGMRI detects the established rows and uses computer vision and machine learning to determine the best segment of row and compares the rest of the field to that segment to give you a relative map. If machine data is integrated, a stand population map is returned.
YOUR MESSAGE WAS SENT SUCCESSFULLY!
We have received your inquiry and we’ll be in touch with you soon.