dots-horizontal

AGMRI Helps Assess Placement of Hybrids

Planning is a critical part of every farming operation, and having accurate information helps farmers make decisions. Determining where to plant different hybrids in a field can have a significant impact on yield potential, so it’s best to make the placement decision with as much information as possible.

AGMRI gives users the option to compare multiple analytic maps of their fields side-by-side, which can reveal important information relevant to hybrid planting. For example, by comparing topographical and vegetation maps, farmers can see how their chosen hybrids are emerging across various field elevations. This can help determine which hybrids perform best in varied field conditions and elevations, impacting future planting decisions across the field.

“A lot of growers like to use AGMRI to figure out differences between hybrids so they can use that information to figure out their placement the following year,” says Conner Schmidt, account manager for Intelinair.


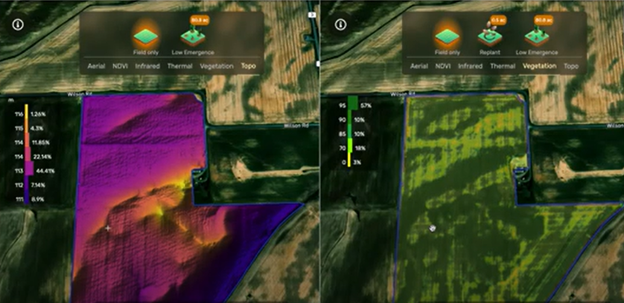
By comparing the topography map to the vegetation map, AGMRI users can see where hybrids have emerged well and are establishing a strong stand.

Lower areas of fields typically retain more moisture, so it’s important to find a hybrid that can better tolerate those conditions. Looking at the elevation of a field compared to the emergence map, users can see which hybrids are best tolerating the wet soil in the low-lying areas of the field.


AGMRI shows that one hybrid emerged better in the lower areas of the field.

“When looking at the vegetation map early in the season, we don’t see a lot of differences in the higher elevation,” says Schmidt. “But as we get into some of this low ground, we can start to see that one hybrid is doing worse than the other in terms of emergence.”

Using AGMRI, this farmer gained new insights into his fields and additional information to help decide which hybrid to plant in various areas of them.

Share This Article

RELATED BLOG POSTS

Yield Forecast

Understand where your corn yield is based on the current state of the crop. As the season unfolds, see how it is having an impact on your final yield.

Yield Loss

Powered by years of Nitrogen research at the University of Missouri, our corn Yield Loss analytic, powered by NVision Ag, gives insight into potential yield loss due to Nitrogen deficiency. Optional analytic for nitrogen management.

Variable Dry Down

variable dry down

Understand which fields and which areas of the field are drying down to help plan your harvest logistics.

Underperforming Area

low crop health

Not all areas of your fields perform the same and low NDVI doesn’t necessarily mean there is anything you can do to fix it this year. Underperforming Area alerts you to the fields and areas of the fields that are performing below their historical potential. This will allow you to quickly find those fields and areas and make adjustments to get them back on target and protect yield.

Nutrient Deficiency

nutrient deficiency

As the crop grows, it can tell us more of what is wrong with it. This analytic finds the fields and areas of the fields where there is a nutrient deficiency so that issues can be addressed before grain fill.

Disease Stress

disease risk

In conjunction with the Thermal Stress, Disease Stress alert takes into account weather information to more precisely indicate the type of stress impacting the crop.

Thermal Stress

thermal risk

Using our thermal imagery, AGMRI can detect elevated heat patterns of the crop that indicate crop stress.

Crop Health

Crop Health

Get a complete view of your farms and fields and identify where yield potential is ranked highest to the lowest.

Weed Map & Weed Escape

weed escape

Know what fields and areas of the fields have weeds. With machine integration or based on planting date, be alerted to what fields have weeds that may be impacting yield.

Historical Field Performance

AGMRI creates 5 performance zones in each field based on the historical average of those zones. This data is used to compare the current season to help understand where you are underperforming from the zone potential.

Low Emergence

low emergence

Notification of what fields and areas of the field have poor emergence.

Stand Assessment

strand assessment

AGMRI detects the established rows and uses computer vision and machine learning to determine the best segment of row and compares the rest of the field to that segment to give you a relative map. If machine data is integrated, a stand population map is returned.