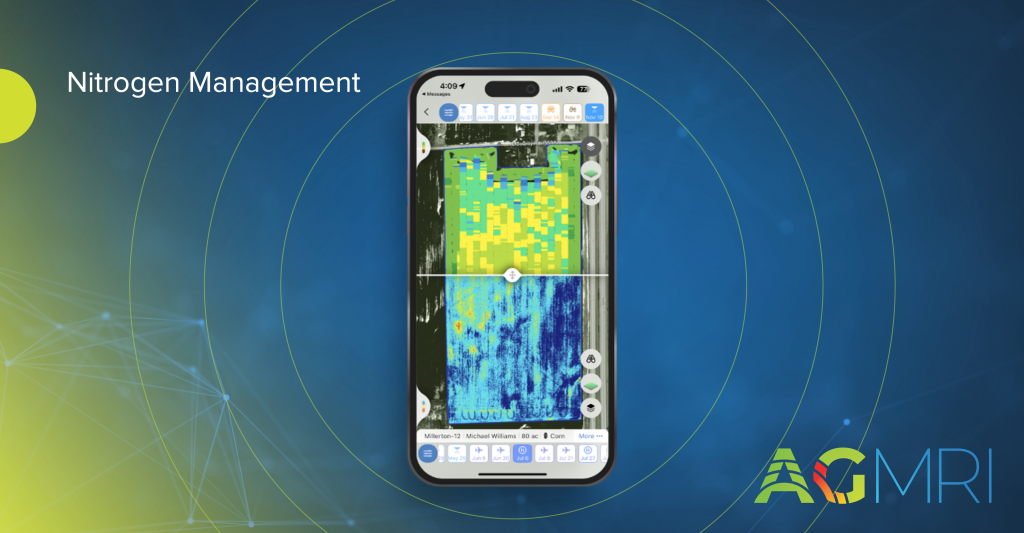
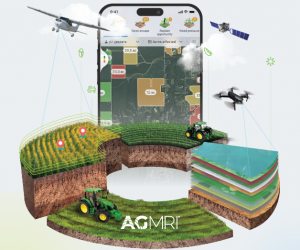
Developed from years of nitrogen research at the University of Missouri, NVision is an add-on capability to the full-season AGMRI package, designed to track and evaluate nitrogen management.
What does NVision do?
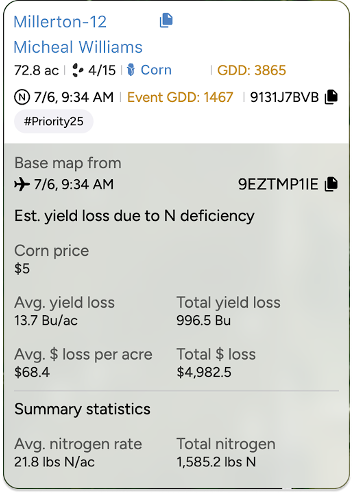
Provides insights into potential corn yield loss due to nitrogen deficiency.
Generates fertilizer prescriptions with clear economic outcomes.
Delivers trusted, real-time insights to move from analysis → action with confidence.
Helps you understand your fields’ nitrogen use by showing how application method and environmental factors lead to nitrogen loss and limiting factors that prevent uptake.
How does NVision work?
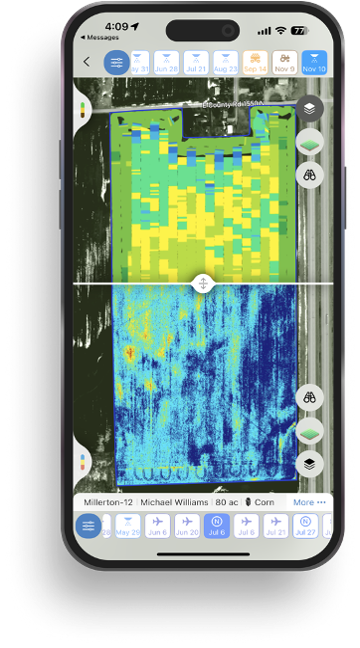
Monitors the corn crop during key growth stages (V8/hip-high to R2/blister, ~800–2000 GDD; N application during these stages may be beneficial)
Estimates:
Yield loss from Nitrogen deficiency
Dollar loss per acre
Fertilizer cost scenarios
User inputs: application type, N product, rate, and monitor type
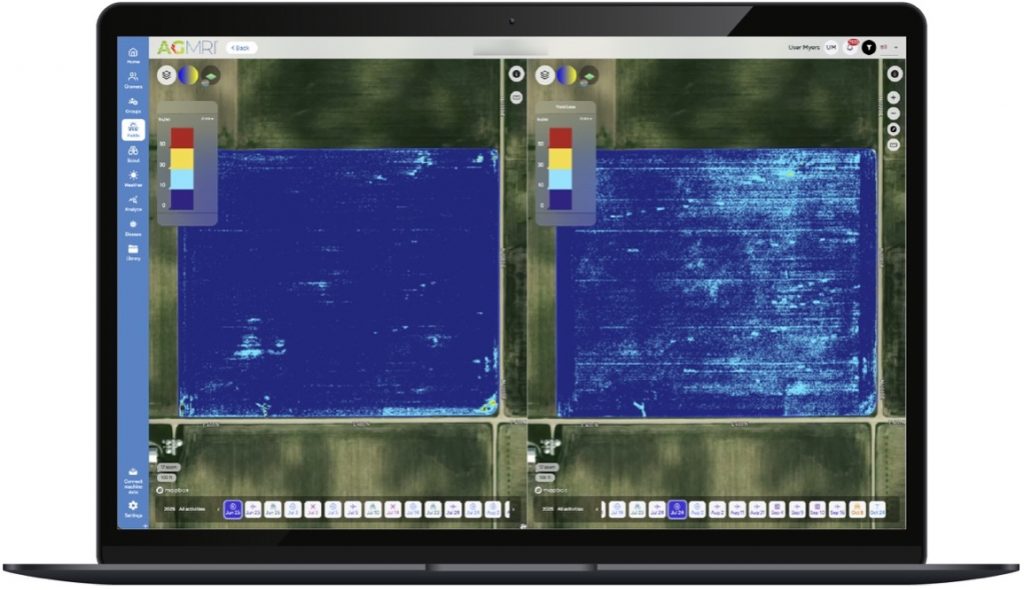
Outputs: prescription maps + economic readout,
Automatically enables the creation of an N application pass in AGMRI
Why NVision?
Direct integration with AGMRI imagery—NVision doesn’t require external inputs.
Moves from insight to action seamlessly, all in one platform.
Enables tailored management: customize N passes to fit grower preferences.
Understand where your corn yield is based on the current state of the crop. As the season unfolds, see how it is having an impact on your final yield.
Yield Loss
Powered by years of Nitrogen research at the University of Missouri, our corn Yield Loss analytic, powered by NVision Ag, gives insight into potential yield loss due to Nitrogen deficiency. Optional analytic for nitrogen management.
Variable Dry Down
Understand which fields and which areas of the field are drying down to help plan your harvest logistics.
Underperforming Area
Not all areas of your fields perform the same and low NDVI doesn’t necessarily mean there is anything you can do to fix it this year. Underperforming Area alerts you to the fields and areas of the fields that are performing below their historical potential. This will allow you to quickly find those fields and areas and make adjustments to get them back on target and protect yield.
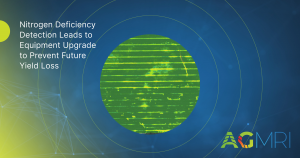
Nutrient Deficiency
As the crop grows, it can tell us more of what is wrong with it. This analytic finds the fields and areas of the fields where there is a nutrient deficiency so that issues can be addressed before grain fill.
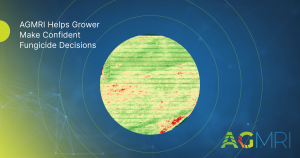
Disease Stress
In conjunction with the Thermal Stress, Disease Stress alert takes into account weather information to more precisely indicate the type of stress impacting the crop.
Thermal Stress
Using our thermal imagery, AGMRI can detect elevated heat patterns of the crop that indicate crop stress.
Crop Health
Get a complete view of your farms and fields and identify where yield potential is ranked highest to the lowest.
Weed Map & Weed Escape
Know what fields and areas of the fields have weeds. With machine integration or based on planting date, be alerted to what fields have weeds that may be impacting yield.
Historical Field Performance
AGMRI creates 5 performance zones in each field based on the historical average of those zones. This data is used to compare the current season to help understand where you are underperforming from the zone potential.
Low Emergence
Notification of what fields and areas of the field have poor emergence.
Stand Assessment
AGMRI detects the established rows and uses computer vision and machine learning to determine the best segment of row and compares the rest of the field to that segment to give you a relative map. If machine data is integrated, a stand population map is returned.
YOUR MESSAGE WAS SENT SUCCESSFULLY!
We have received your inquiry and we’ll be in touch with you soon.