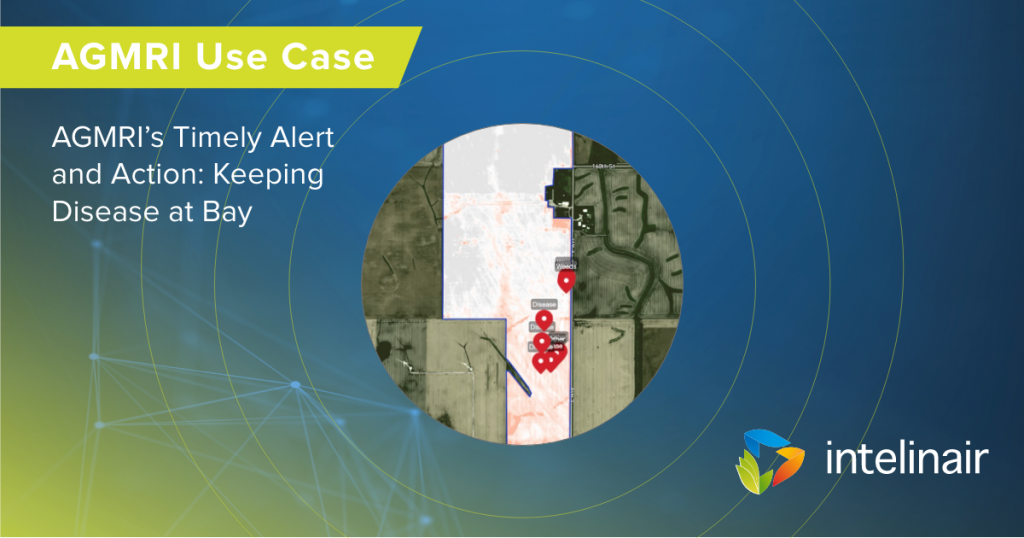
dots-horizontal

AGMRI’s Timely Alert and Action: Keeping Disease at Bay

Background

In early July, an Iowa farm manager noticed one of his fields appeared to be thriving and progressing well. This particular field consistently yielded excellent results for various crops and received meticulous management due to its proximity to the home place. He had plans to apply fungicide in the upcoming weeks to protect the crop.

However, upon reviewing AGMRI imagery, he spotted a thermal stress alert and decided to investigate further. His scouting efforts led to the identification of Northern Corn Leaf Blight. Recognizing the urgency, the grower decided to move up the fungicide application to the first week of the following month.

Challenge

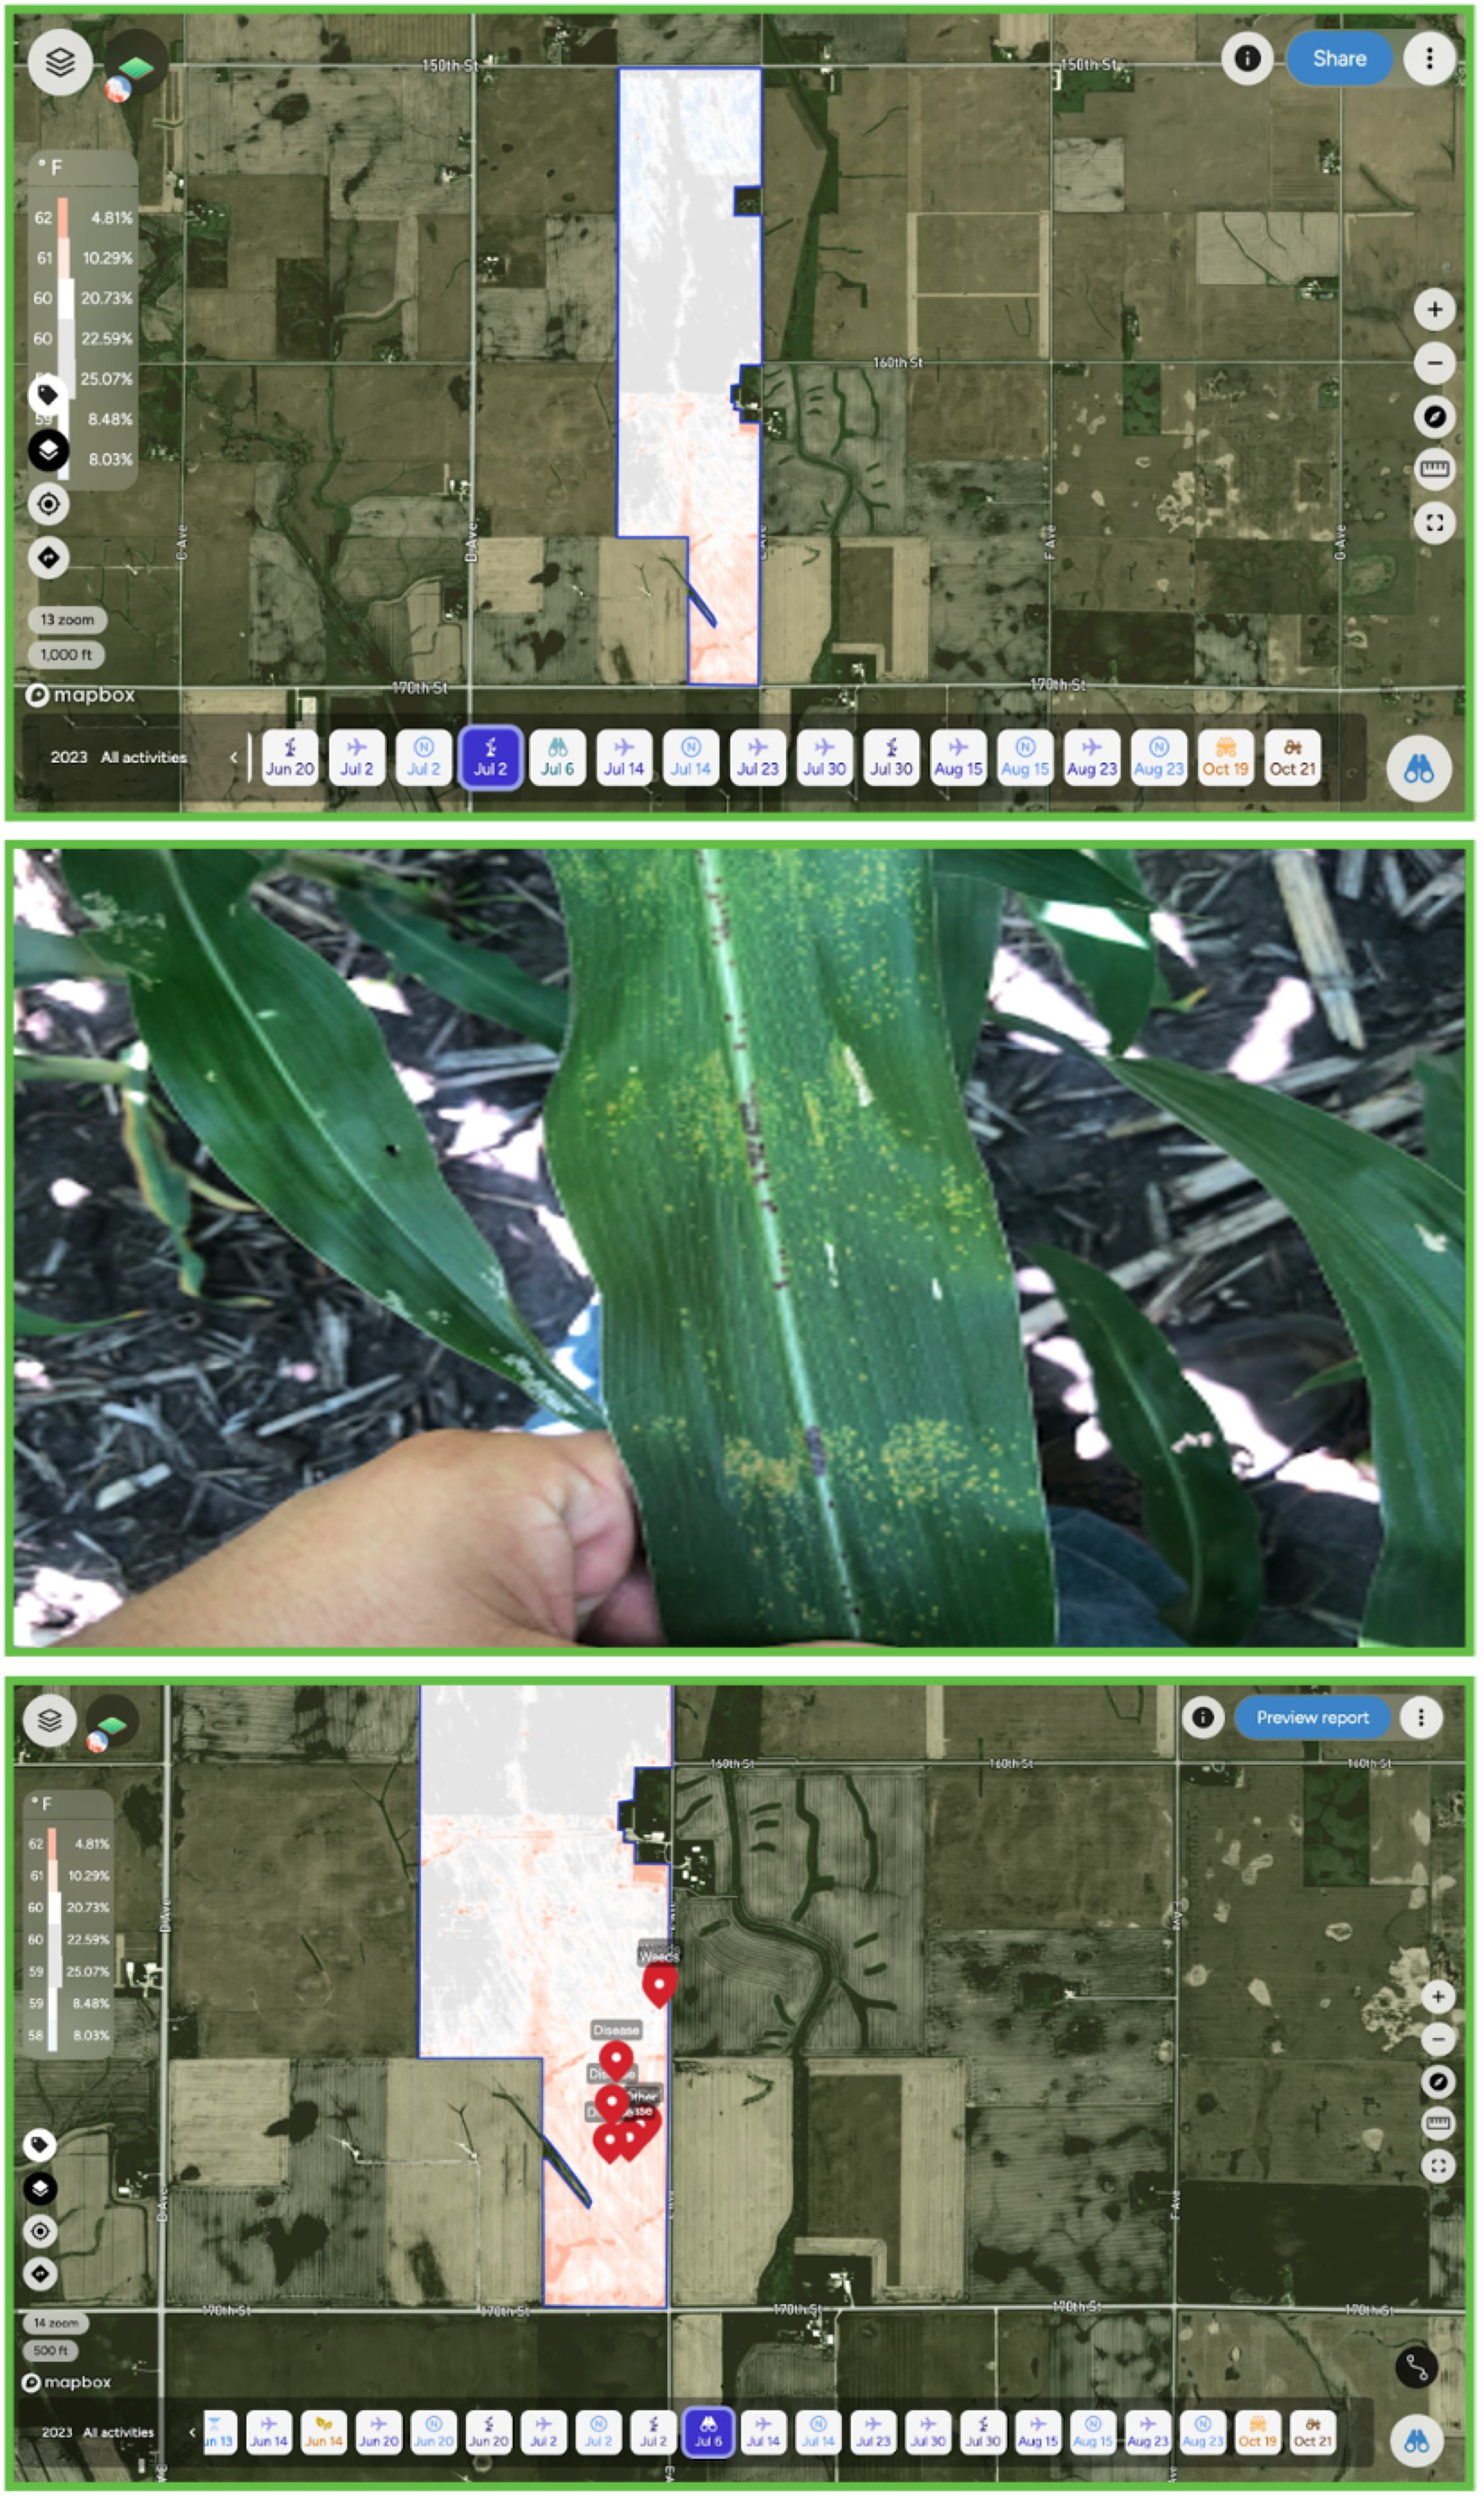
While his fields initially appeared clean, a “wind blown” pattern emerged in the south end, resembling a potential disease outbreak. Despite his annual fungicide applications, he grappled with questions about the ROI and effectiveness of this practice. Like many other farmers during peak disease timing, he was uncertain whether spraying fungicide was worth the investment.

Solution

AGMRI played a crucial role in addressing the challenge. The thermal mapping in AGMRI revealed the pattern within the field, suggesting the potential presence of disease. Scouting efforts confirmed the disease, prompting the grower to make the decision to spray earlier than initially planned. AGMRI’s insights allowed for a well-informed and timely response.

Results

The area sprayed early is forecasted to yield an impressive 230 bushels per acre. Going forward, the grower intends to use AGMRI for disease presence detection and fungicide timing, further enhancing the farm’s disease management practices. This success story underscores the practical benefits of AGMRI in optimizing disease control and protecting yield. This grower’s ROI is expected to be both qualitative and quantitative, with the early-sprayed area forecasted to demonstrate the effectiveness of timely disease management.


View the Full Use Case

Share This Article

RELATED BLOG POSTS

Yield Forecast

Understand where your corn yield is based on the current state of the crop. As the season unfolds, see how it is having an impact on your final yield.

Yield Loss

Powered by years of Nitrogen research at the University of Missouri, our corn Yield Loss analytic, powered by NVision Ag, gives insight into potential yield loss due to Nitrogen deficiency. Optional analytic for nitrogen management.

Variable Dry Down

variable dry down

Understand which fields and which areas of the field are drying down to help plan your harvest logistics.

Underperforming Area

low crop health

Not all areas of your fields perform the same and low NDVI doesn’t necessarily mean there is anything you can do to fix it this year. Underperforming Area alerts you to the fields and areas of the fields that are performing below their historical potential. This will allow you to quickly find those fields and areas and make adjustments to get them back on target and protect yield.

Nutrient Deficiency

nutrient deficiency

As the crop grows, it can tell us more of what is wrong with it. This analytic finds the fields and areas of the fields where there is a nutrient deficiency so that issues can be addressed before grain fill.

Disease Stress

disease risk

In conjunction with the Thermal Stress, Disease Stress alert takes into account weather information to more precisely indicate the type of stress impacting the crop.

Thermal Stress

thermal risk

Using our thermal imagery, AGMRI can detect elevated heat patterns of the crop that indicate crop stress.

Crop Health

Crop Health

Get a complete view of your farms and fields and identify where yield potential is ranked highest to the lowest.

Weed Map & Weed Escape

weed escape

Know what fields and areas of the fields have weeds. With machine integration or based on planting date, be alerted to what fields have weeds that may be impacting yield.

Historical Field Performance

AGMRI creates 5 performance zones in each field based on the historical average of those zones. This data is used to compare the current season to help understand where you are underperforming from the zone potential.

Low Emergence

low emergence

Notification of what fields and areas of the field have poor emergence.

Stand Assessment

strand assessment

AGMRI detects the established rows and uses computer vision and machine learning to determine the best segment of row and compares the rest of the field to that segment to give you a relative map. If machine data is integrated, a stand population map is returned.