dots-horizontal

Analyzing Weeds and Escapes with AGMRI

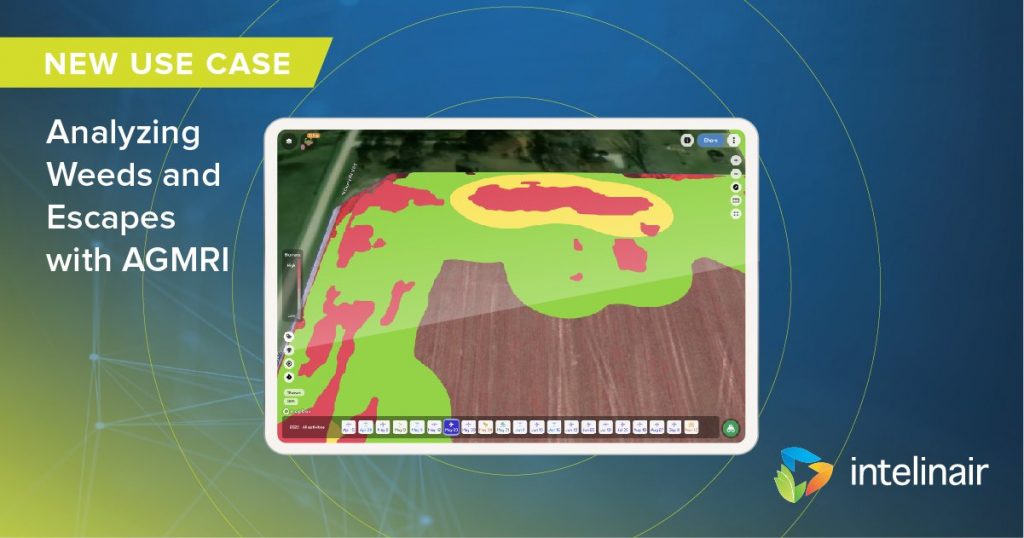
AGMRI uses infrared imagery to analyze weeds and escapes to create maps identifying where there may be pockets of weeds through the V6 growth stage for corn and 35 days for soybeans.

How it Works:

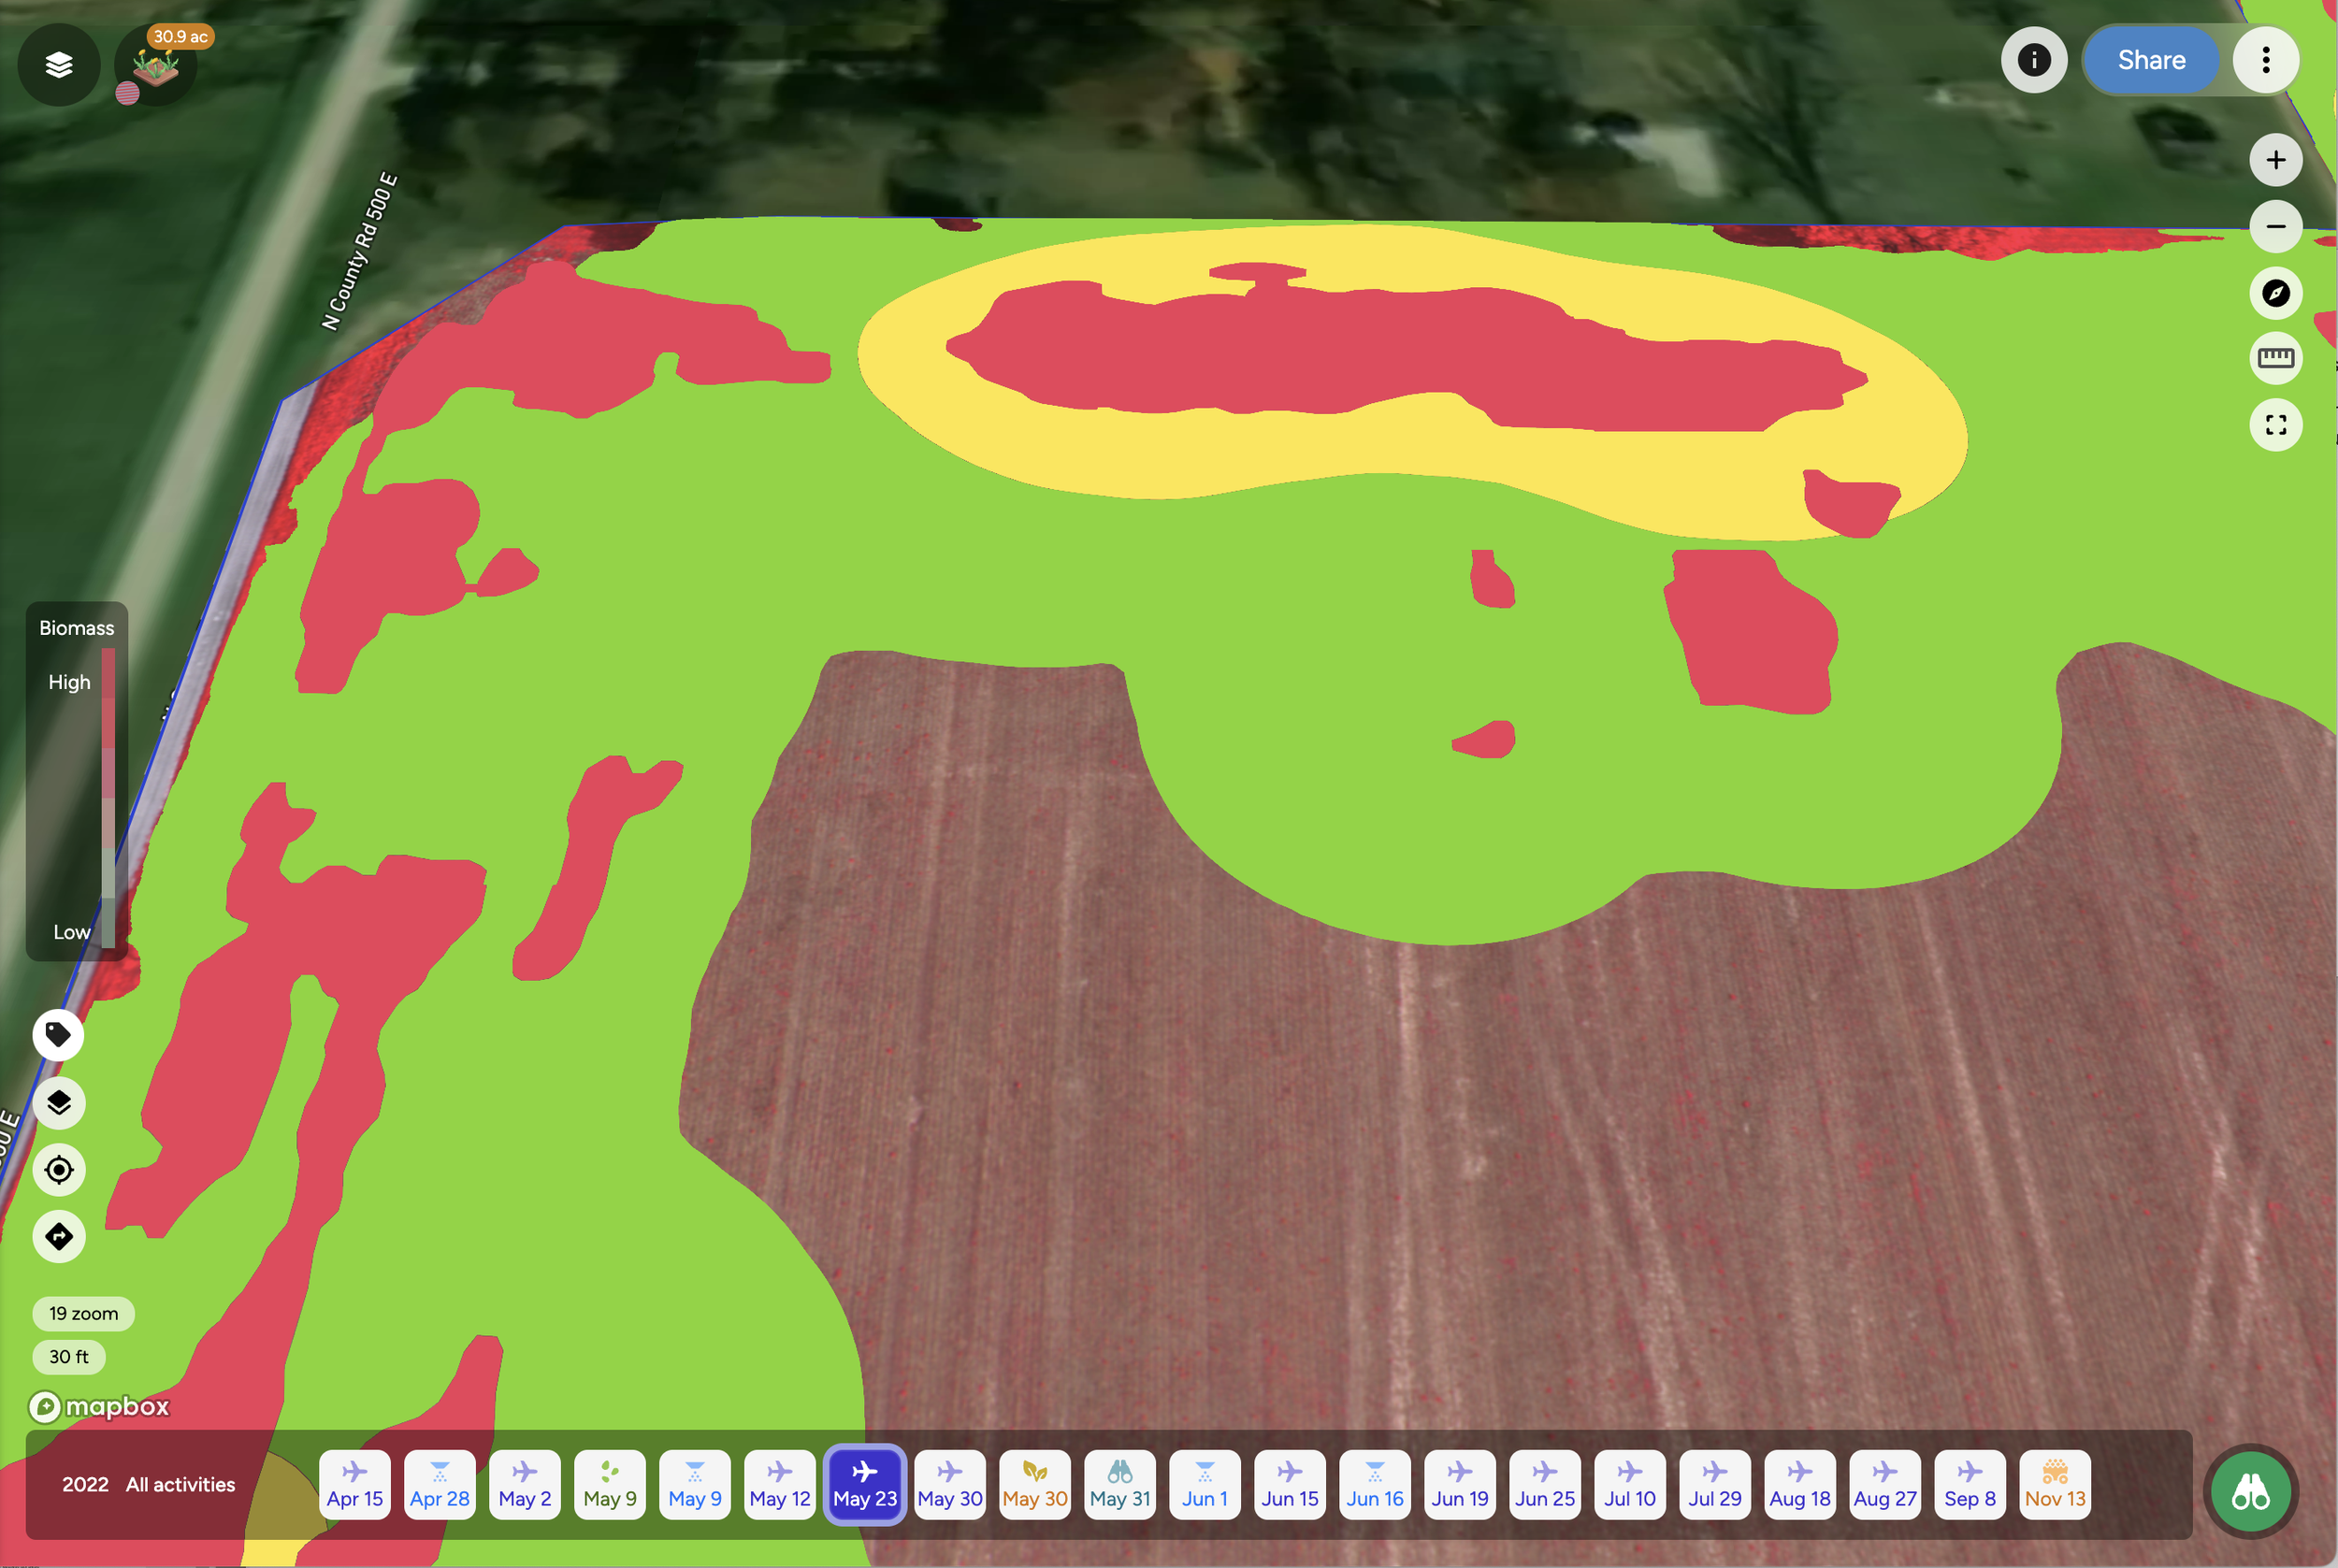
AGMRI uses infrared technology to detect plant material believed to be weeds and marks accordingly the density on the weed map. If a field has recently been sprayed with herbicide per available machine data and there are weeds detected, an alert will trigger as a weed escape notification.

Consider scouting the field in order to identify the weed species present and the growth to determine next steps.

Use Example:

When evaluating weed pressure, AGMRI users can pull up the weed map to understand exactly where to scout a field for weeds. Also using the map they can determine the acres affected by weeds or weed escape.

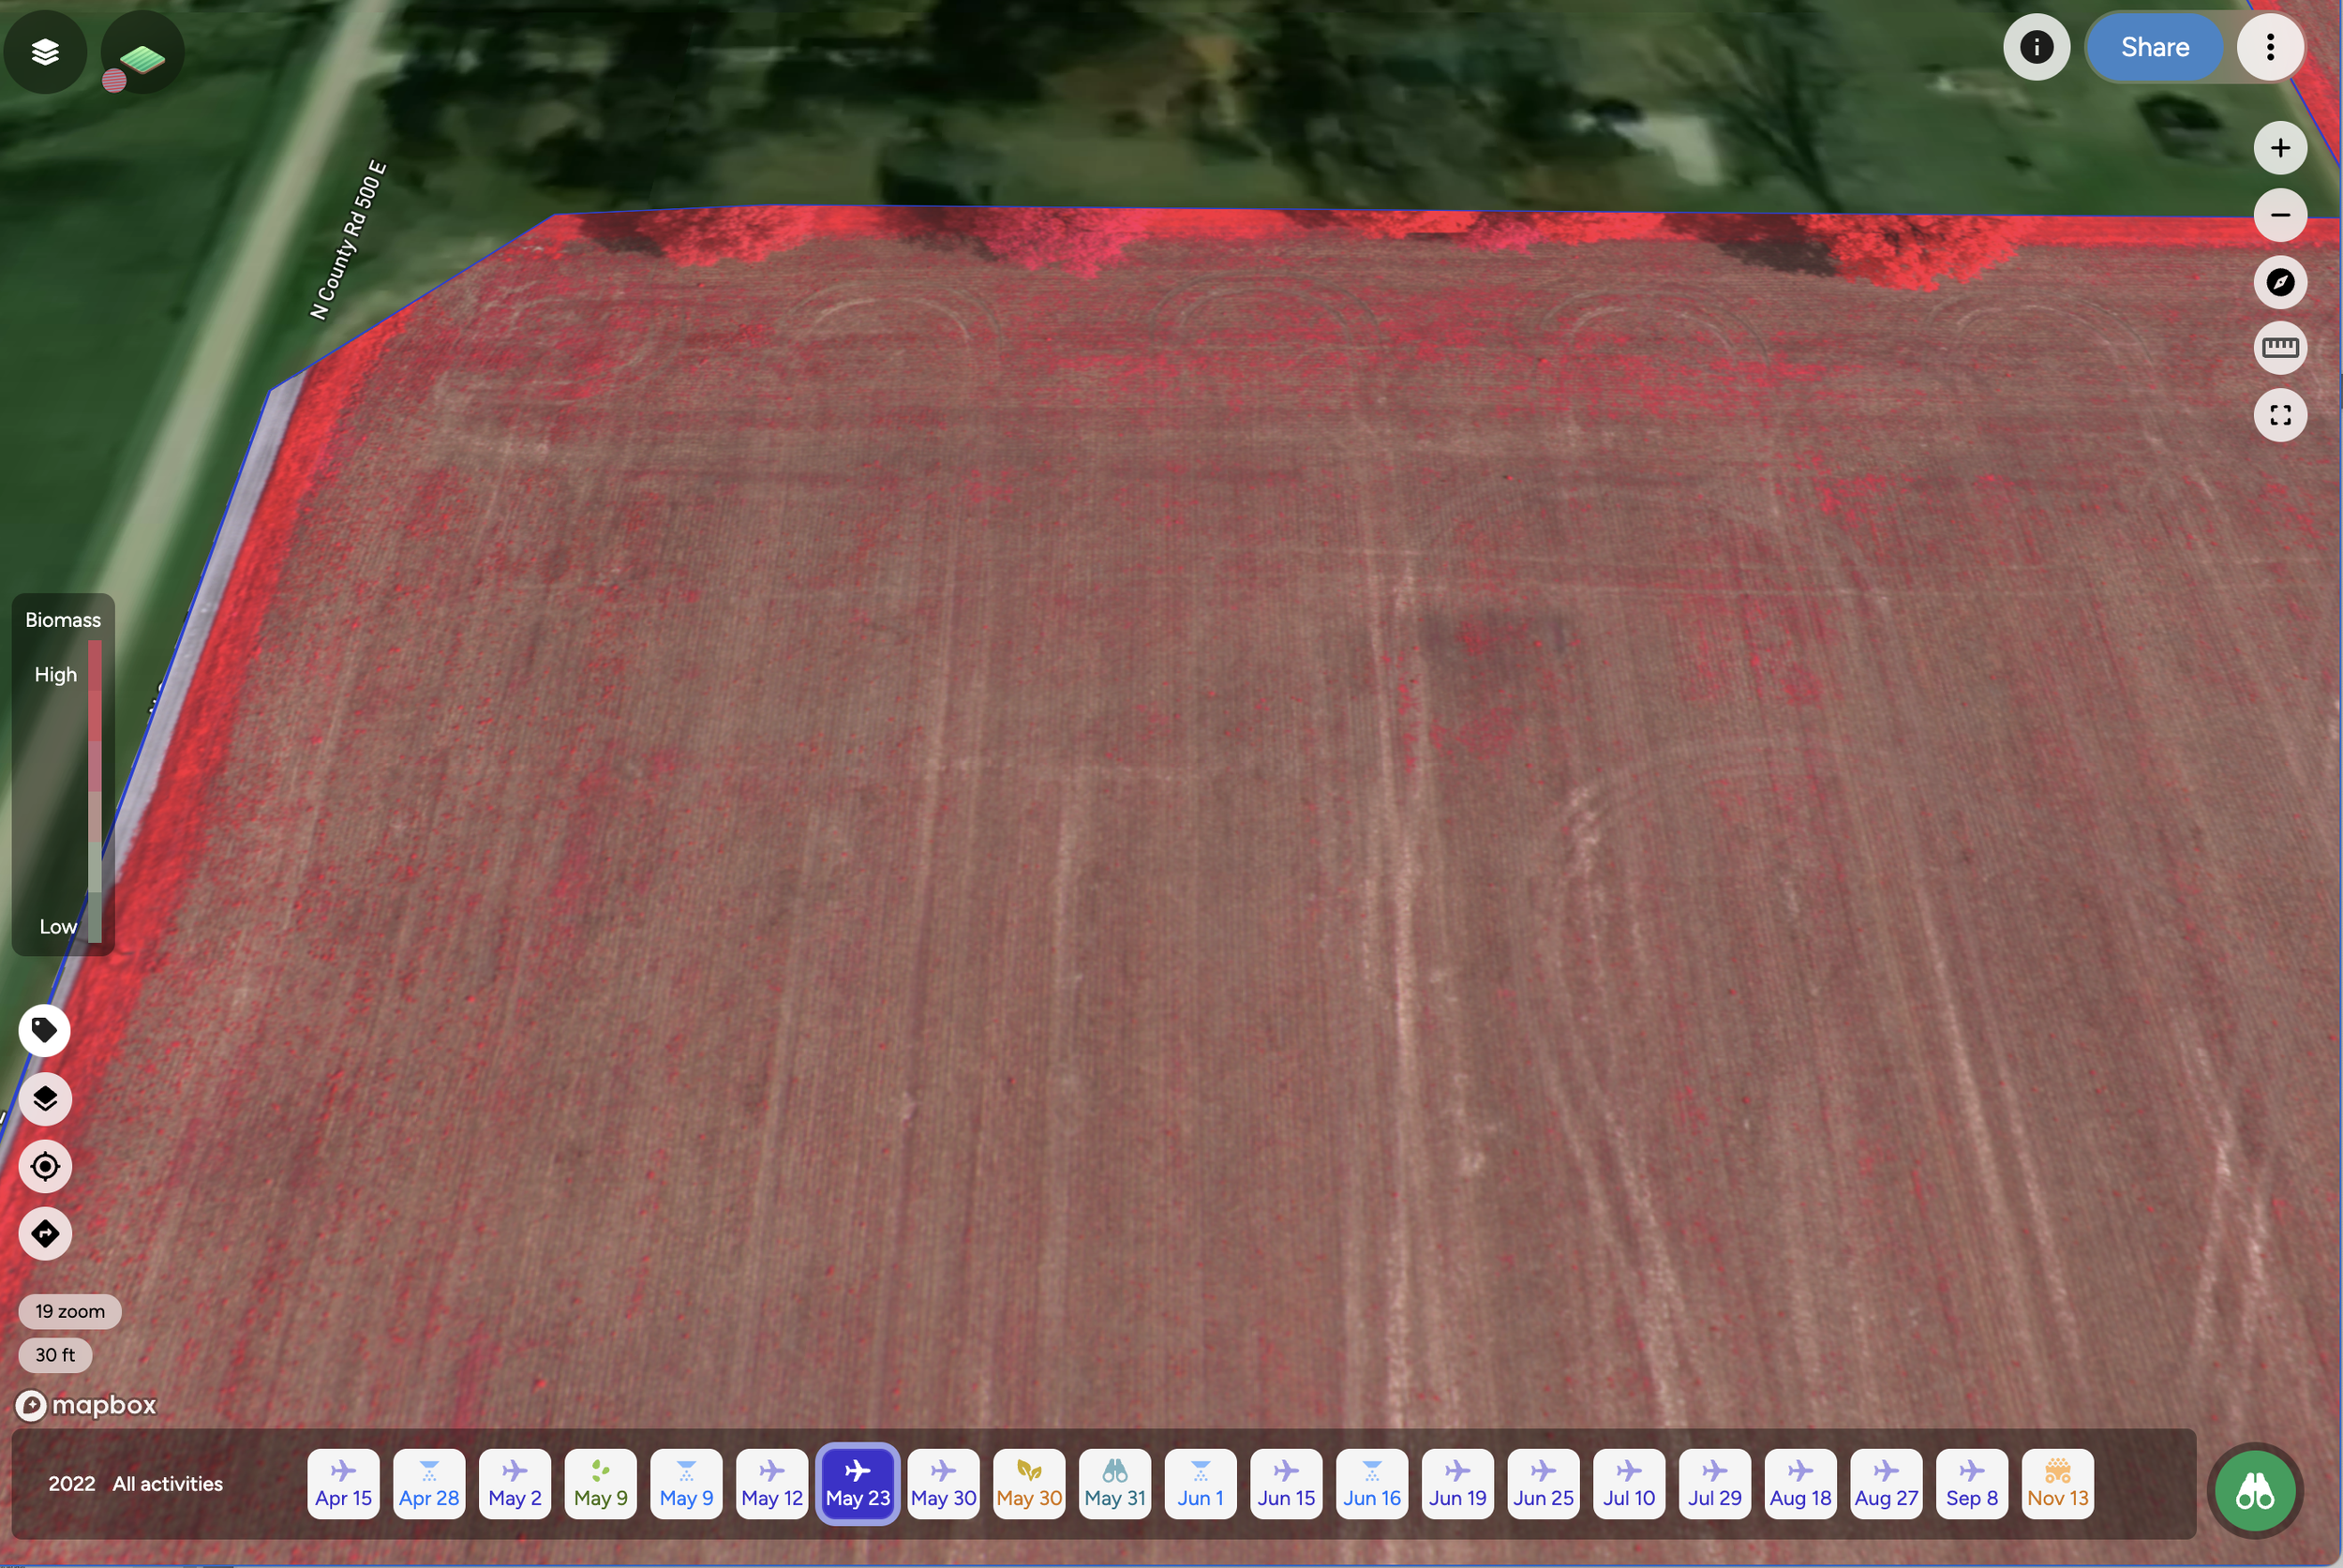
The weed map can also be used to see how your weed control program is holding up, check back after a spray application to see if weeds are still present, or adjust the rate of herbicide according to the label use rate.


Comparison of Alert Versus Imagery

BARKER Weed Pressure.png


BARKER Infrared (No Weed Pressure Polygons).png

AGMRI Use + Solution: 

AGMRI alerts users to areas of weed concentrations, helping to ease time constraints and increase efficiency. With the map, users can know exactly where in the field they need to review. In this situation, they were able to identify the best solution to mitigate the exact weed species found in the field.

Scouting Tip: 

AGMRI makes scouting for weeds quick as you know exactly where to go.  Capture these observations in the AGMRI tool to determine next steps:

  1. Identify weeds present – Many universities have great resources including apps or pocket guides.

  2. Note the weed height or stage of weed.

  3. Determine concentration or area – AGMRI bird’s eye view can also help quantify acres affected.


Contact us for more information or to schedule an AGMRI demo.

Share This Article

RELATED BLOG POSTS

Yield Forecast

Understand where your corn yield is based on the current state of the crop. As the season unfolds, see how it is having an impact on your final yield.

Yield Loss

Powered by years of Nitrogen research at the University of Missouri, our corn Yield Loss analytic, powered by NVision Ag, gives insight into potential yield loss due to Nitrogen deficiency. Optional analytic for nitrogen management.

Variable Dry Down

variable dry down

Understand which fields and which areas of the field are drying down to help plan your harvest logistics.

Underperforming Area

low crop health

Not all areas of your fields perform the same and low NDVI doesn’t necessarily mean there is anything you can do to fix it this year. Underperforming Area alerts you to the fields and areas of the fields that are performing below their historical potential. This will allow you to quickly find those fields and areas and make adjustments to get them back on target and protect yield.

Nutrient Deficiency

nutrient deficiency

As the crop grows, it can tell us more of what is wrong with it. This analytic finds the fields and areas of the fields where there is a nutrient deficiency so that issues can be addressed before grain fill.

Disease Stress

disease risk

In conjunction with the Thermal Stress, Disease Stress alert takes into account weather information to more precisely indicate the type of stress impacting the crop.

Thermal Stress

thermal risk

Using our thermal imagery, AGMRI can detect elevated heat patterns of the crop that indicate crop stress.

Crop Health

Crop Health

Get a complete view of your farms and fields and identify where yield potential is ranked highest to the lowest.

Weed Map & Weed Escape

weed escape

Know what fields and areas of the fields have weeds. With machine integration or based on planting date, be alerted to what fields have weeds that may be impacting yield.

Historical Field Performance

AGMRI creates 5 performance zones in each field based on the historical average of those zones. This data is used to compare the current season to help understand where you are underperforming from the zone potential.

Low Emergence

low emergence

Notification of what fields and areas of the field have poor emergence.

Stand Assessment

strand assessment

AGMRI detects the established rows and uses computer vision and machine learning to determine the best segment of row and compares the rest of the field to that segment to give you a relative map. If machine data is integrated, a stand population map is returned.