The following article was drafted by Keith Porter, senior agronomist for Intelinair.
Blazing temperatures have swept through much of the midwest these past two weeks, breaking 50-year seasonal records in some areas of Indiana. Prolonged heat and dryness can severely harm crops and yield potential. Knowing where and how your fields have been affected by these extreme weather conditions is crucial to making sound management decisions for the rest of the season, and AGMRI’s crop health map and analytics can help.
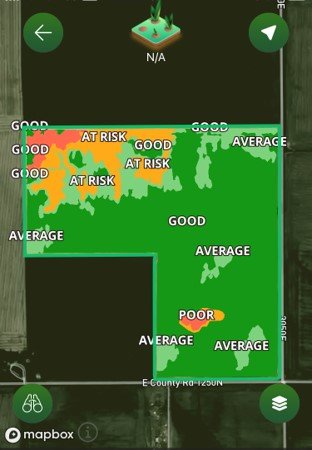
AGMRI’s Crop Health map (figure 1) automatically identifies crops under stress, marking them one of four degrees of severity: Good, Average, At Risk, and Poor. The At Risk and Poor categories are the ones to watch for–they might indicate areas where yield potential is at risk. If enough acres fall under either of these categories, AGMRI will notify the account manager with an alert. Scouting the acres in question can determine the cause of the stress and inform future input decisions.
“Defining areas of crop stress and the potential issues can help farmers in making timely decisions regarding the management of their crops in seasons like this,” says Keith Porter, senior agronomist for Intelinair.

Figure 1: Crop Health Map
To verify or better understand the findings of the crop health map, AGMRI users can consult Thermal and VEG imagery. Both of these analytics provide deeper insight into what is going on in the fields that triggers a low crop health alert.
THERMAL
When under stress, crops give off more heat than usual. This effect is visible on AGMRI’s thermal imagery. Look for subtle, wispy areas of heat (red color on the thermal map) indicating increased stress, noted in figure 2 below:

Figure 2: Thermal Map
The area in the upper left of the field appears to be under stress, as indicated by the wispy area of heat. The upper right corner, for comparison, is solid and very red–likely unmanaged acres or bare soil rather than stressed crop.
Elevated heat on thermal imagery may also be indicative of potential disease pressure in some cases. Send scouts to the acres in question to verify.
VEG
AGMRI’s VEG layer, or Vegetative health index, displays crop vigor through tracking how much green plant matter is detected in an area. Darker green on the map shows denser plant growth, while yellow areas may indicate weak growth, poor leaf development, rolling, or other stress factors. The following image shows a poor VEG rating in the upper left of the same field:

Figure 3: VEG map
“Using the combined image and data layers within AGMRI to identify issues and provide direction for effective scouting is a definite advantage in a stress challenged season such as this one,” says Porter.


