Background
In late May-early June, AGMRI field health analytics raised concerns about the performance disparity between the east and west ends of a cornfield in Illinois. The grower initially doubted these findings, as the east end had better soil quality with manure application and a higher total nitrogen content. Even the Climate FieldView™ data indicated that the east side was superior.
Challenge
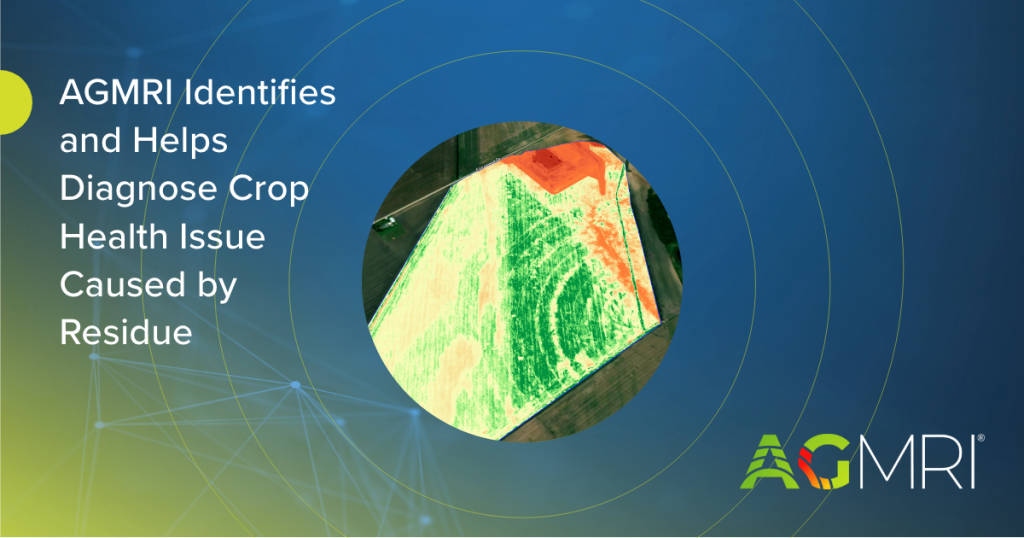
Upon inspection of the June 8 crop health map, a significant issue was identified on the east end – strips of low crop health were observed. In the field, the strips of low crop health observed in the imagery on the east side of the field showed a significant difference in height when compared to the strips that had higher crop health, despite being at the same growth stage. It was also noticed that heavy residue was concentrated in these low-health areas.
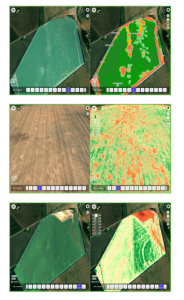 An analysis using AGMRI correlated these strips with the previous year’s harvest map, revealing that the residue spreader had not distributed the residue far enough.
Despite two passes with tillage equipment, thick mats of residue persisted, adversely affecting the current year’s crop. This issue was more pronounced on the east side due to the typically higher yields in that area, resulting in more biomass that needed to be spread.
Solution
The grower made two decisions based on his observations. He decided to address this issue by applying 28% nitrogen to expedite residue breakdown and help the lagging crop catch up due to residue interference. Additionally, equipment changes were planned, including a change to the spreader, based on the observation of similar issues on other fields. The grower believes these measures will mitigate yield losses caused by inadequate residue spreading in the future.
Results
Following these interventions, the east end of the field showed remarkable improvement and began outperforming the west end. The residue streaks previously evident on the east side began to disappear. The grower credited AGMRI for uncovering and addressing this issue. Without AGMRI, it would have been challenging to identify the problem’s root cause and its connection to the poor residue spreading pattern. Not only did the grower protect yield potential in this specific field, but the experience also influenced other management decisions to improve yield. AGMRI’s role in this successful intervention highlights its significance in elevating management decisions to optimize yields.


