dots-horizontal

Enhancing Crop Stress Mitigation Using AGMRI’s Yield Forecast Tool

Background

A central Indiana farmer has been using AGMRI for three consecutive years across all his acres. His farm primarily consists of corn and soybeans, and this season faced severe dry conditions. With the desire to explore stress mitigation products, he turned to AGMRI for in-season insights. The majority of his farm consists of Fincastle soil, which is prone to stress during dry periods.

Challenge

The main challenge this farmer faced was the need to mitigate stress in his crops due to the persistent dry climate in his area. The choice to apply stress mitigation products was based on the anticipation of stress, as there was not a specific issue at the time. The farmer’s concern was finding the right products for his acres, amidst a market flooded with options. He risked the potential significant yield loss.

Solution

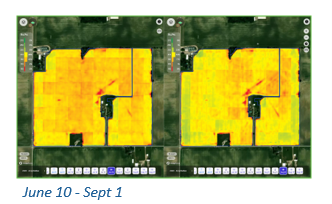
AGMRI played a crucial role in addressing this farmer’s challenge. He was using AGMRI to follow crop health, rate of growth, log in field characteristics via the scouting tool, and perform yield comparisons at the end of season. The product in this trial offered flexibility in application methods so to suit his needs, the farmer opted to apply the stress mitigator with his fungicide pass. He decided to apply the stress mitigation product in combination with fungicide around July 20. By analyzing multiple map layers, the most valuable one being the Yield Forecast tool, he tracked the field’s performance for initial changes. The Yield Forecast feature provided clear evidence of yield differences within and outside the applied areas around July 24 and again around August 8. As a result, he predicted a positive yield increase in the application zone.

Results

Based on AGMRI’s Yield Forecast map, the farmer observed a potential yield increase of over 10 bushels in the applied zones. Encouraged by these findings, he plans to continue using AGMRI and intends to replicate the trial in the following season. His future plans include conducting year-over-year comparisons to assess the product’s ROI. Based on his experiences last season the farmer is now an advocate for late-season stress mitigation products, firmly believing in their effectiveness with the support of AGMRI.


View the Full Use Case

Share This Article

RELATED BLOG POSTS

Yield Forecast

Understand where your corn yield is based on the current state of the crop. As the season unfolds, see how it is having an impact on your final yield.

Yield Loss

Powered by years of Nitrogen research at the University of Missouri, our corn Yield Loss analytic, powered by NVision Ag, gives insight into potential yield loss due to Nitrogen deficiency. Optional analytic for nitrogen management.

Variable Dry Down

variable dry down

Understand which fields and which areas of the field are drying down to help plan your harvest logistics.

Underperforming Area

low crop health

Not all areas of your fields perform the same and low NDVI doesn’t necessarily mean there is anything you can do to fix it this year. Underperforming Area alerts you to the fields and areas of the fields that are performing below their historical potential. This will allow you to quickly find those fields and areas and make adjustments to get them back on target and protect yield.

Nutrient Deficiency

nutrient deficiency

As the crop grows, it can tell us more of what is wrong with it. This analytic finds the fields and areas of the fields where there is a nutrient deficiency so that issues can be addressed before grain fill.

Disease Stress

disease risk

In conjunction with the Thermal Stress, Disease Stress alert takes into account weather information to more precisely indicate the type of stress impacting the crop.

Thermal Stress

thermal risk

Using our thermal imagery, AGMRI can detect elevated heat patterns of the crop that indicate crop stress.

Crop Health

Crop Health

Get a complete view of your farms and fields and identify where yield potential is ranked highest to the lowest.

Weed Map & Weed Escape

weed escape

Know what fields and areas of the fields have weeds. With machine integration or based on planting date, be alerted to what fields have weeds that may be impacting yield.

Historical Field Performance

AGMRI creates 5 performance zones in each field based on the historical average of those zones. This data is used to compare the current season to help understand where you are underperforming from the zone potential.

Low Emergence

low emergence

Notification of what fields and areas of the field have poor emergence.

Stand Assessment

strand assessment

AGMRI detects the established rows and uses computer vision and machine learning to determine the best segment of row and compares the rest of the field to that segment to give you a relative map. If machine data is integrated, a stand population map is returned.