
Welcome to our next installment of our blog series on data analytics. In our previous blog, we introduced you to Intelinair’s AGMRI platform and its advanced analytics capabilities. Today, we’ll delve into the diverse range of data sources that power our platform and inform our machine learning models.
Types of Data
Data is the lifeblood of our advanced analytics and machine learning models. Intelinair’s AGMRI platform collects a wide array of data types from various sources to provide valuable insights into field conditions throughout the entire growing season. Let’s explore these data types in detail:
Imagery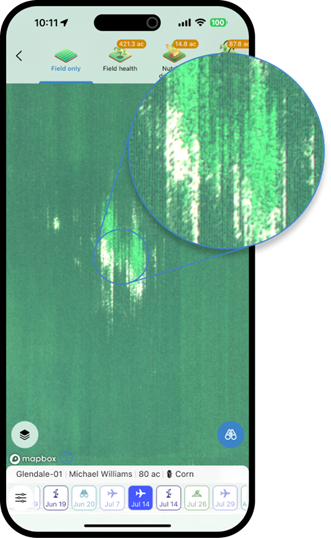
Fixed-Wing Imagery (15cm GSD): This type of imagery offers detailed information about crop health, growth stages, and yield potential. It enables us to conduct row-level analytics, identifying patterns in crop growth, and providing detailed insights even in early growth stages. For instance, we can evaluate crop emergence at the start of the season, aiding in replant decisions.
- Satellite High-Resolution Imagery (varies between 30-150cm GSD): In areas outside our coverage for fixed-wing analytics, we partner with Airbus to provide high-resolution satellite imagery. This data offers insights into crop development.
- Drone Imagery (available on-demand, up to 2mm GSD): This provides highly detailed imagery of specific areas within a field or crop. It allows our machine learning models to compute analytics requiring individual-plant level detail, such as accurate stand count and emergence evaluation.
- Historical Imagery (10-100m GSD): Sentinel-2 imagery, though at lower resolution, helps build historical field-level context spanning multiple seasons. This historical data aids in identifying anomalies relative to a field’s historical performance.
Other Data Sources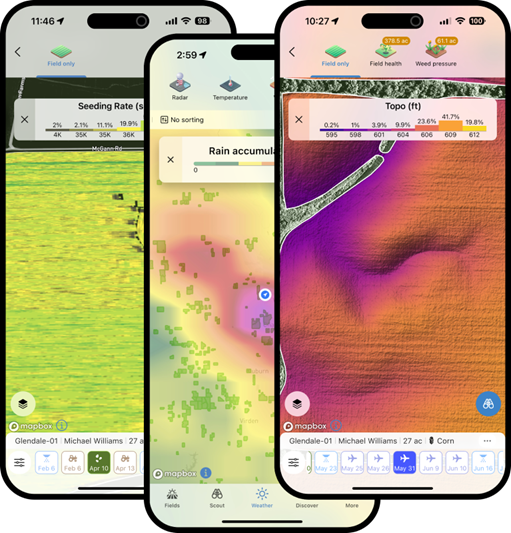
- Machine Data: This data source offers insights into farming practices and operations like planting, spraying, and harvest. When integrated with other sources, our algorithms apply relevant models to track growth stage progressions and provide detailed analytical results.
- Weather Data: Weather is a crucial, unpredictable factor during the growing season. Weather data plays a pivotal role in understanding the context of each field, helping track field progression and providing additional input for our algorithms.
- Topography: Field topography influences plant growth. Understanding the topography of each individual field is essential for contextualizing crop development.
- Other Data: In addition to the main data types, Intelinair collects supplementary data, including scout reports and soil type information, which contribute to our analytics algorithms.
AGMRI Platform Representation
To make data more accessible and actionable, we’ve developed convenient representations within the AGMRI platform:
Field
Each individual field is defined by boundaries, to which analytics are applied. Growth stages are tracked within these boundaries, and all flights are assigned specific imagery for that field.
Remote-Sensing Flight
In the field of agriculture, being able to gather information beyond what our eyes can see is crucial for understanding and analyzing crops. We collect this information using remote sensing, which involves using sensors that capture imagery in the Near Infrared and thermal spectrum. This kind of information helps create measurements like the NDVI, which helps analyze the crop health. We use remote sensing from both airplanes and satellites in our algorithms to provide valuable insights to our customers.
Remote-sensing imagery includes fixed-wing, high-resolution satellite, or drone imagery. Each capture is cropped by field boundaries, and relevant analytics are applied. Users can select any flight and view the field’s condition at that moment, along with alerts and insights generated by our algorithms.
Alerts
Alerts are generated from remote-sensing flights and provide detailed maps produced by our algorithms. These alerts include critical information affecting yield potential, such as low emergence alerts, low field health, and variable dry-down alerts.
Field Activity
Depending on your equipment setup, we collect and present equipment actions with all details. These include planting operations, herbicide applications, nutrient applications, and harvest operations. For example, this could be useful as additional context for analysis of the field. Tracking these operations helps you monitor their impact on subsequent flights.
Application Activity
Application includes a detailed map of the application of different products along with their application rates.
Planting Activity
Planting activity map displays a detailed planting map with varying seeding rates
Harvest Activity
Harvest activity map presents a detailed harvest map with varying yield rates and yield statistics for the harvested area.
Tillage Activity
Tillage activity displays tillage areas along with their corresponding tillage depths.
Field Zoning and Yield Estimation Activities
Our Precision Zoning Tool allows farmers to generate customized zoning maps, analyzing different productivity zones within fields. This data informs precise application activities on the field. Additionally, our Yield Estimate Scouting Tool enables reasonably accurate yield estimates based on kernel counts from different areas of the field.
Summary
In summary, Intelinair’s AGMRI platform collects a wealth of data types, from imagery and machine data to weather information and topography, to provide continuous insights into field conditions throughout the growing season. These insights help identify potential issues, predict yield potential, and make informed decisions about crop management, fertilizer application, pest control, and other critical aspects of crop production.
Our platform offers user-friendly representations, allowing users to extract maximum value from data and algorithm outputs. With the ability to track growth stages, monitor field operations, and access relevant field data, farmers can make real-time crop management decisions throughout the growing season. Stay tuned for the next part of our blog series, where we’ll explore the practical applications of Intelinair’s AGMRI platform. If you are interested in learning more reach out to us!


