dots-horizontal

Detecting Disease: Prioritizing Applications

Fungicides have always been a game-time decision. And, with input prices sky-rocketing for 2022 – it could be an interesting year for those in agriculture making the decision to spray or not to spray. One thing’s for sure: disease can wreak havoc in a field. You don’t have to look any further than Tar Spot in 2021 to get to that conclusion.

Tar Spot took many in the Midwest by storm in 2021. But, close monitoring and quick triggers to treat the fields saved many farmers’ from significant loss.

“The windows for fungicide applications are always tight and last year was not exception,” says Matt Schoenbrod, account manager for Intelinair. “However, AGMRI customers were able to monitor their fields, prioritize applications and ultimately justify whether or not to spray a second application.”

For Schoenbrod and his customers, AGMRI detected signs of stress in the field before Tar Spot was visible.


July 2 images of a Central Illinois corn field. The NDVI image (on the left) did not indicate any signs of crops stress, however the thermal image (right) indicated some level of stress.

“Our thermal map showed some stress in the field in Central Illinois early in July,” adds Schoenbrod. “We knew nothing else was going on in the field and recommended scouting. Just like a human MRI, early detection is important.”

The customer scouted but did not see anything out of the ordinary in the field. But, flagging that area to scout later proved dividends.

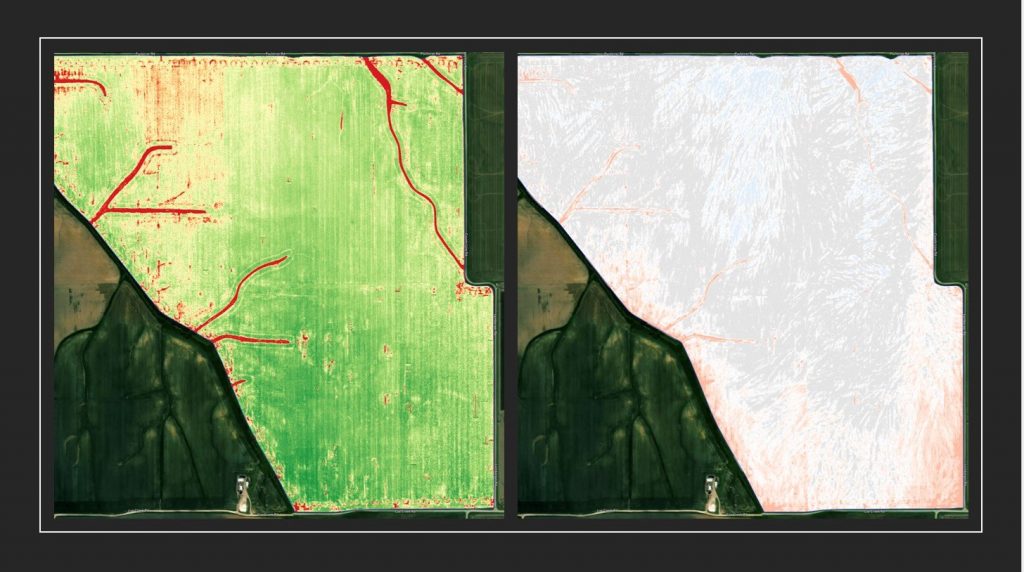
“By July 28, other maps – including NDVI – showed a lot of stress. The customer went to scout the field again and this time found tar spot,” explained Schoenbrod. “The flagged areas provided by monitoring took the guess work out of where to scout and protected the fields’ profit potential.”


NDVI (left) and thermal (right) captured on July 28 in the same field with a verified Tar Spot infestation.


AGMRI helps customers monitor fields, know exactly where to scout when stress occurs, and helps them prioritize where fungicide applications take place. With everyone on edge with input prices, AGMRI provides the backup needed to justify the decision to spray or not to spray, along with pulling the trigger on a second fungicide application.


Share This Article

RELATED BLOG POSTS

Yield Forecast

Understand where your corn yield is based on the current state of the crop. As the season unfolds, see how it is having an impact on your final yield.

Yield Loss

Powered by years of Nitrogen research at the University of Missouri, our corn Yield Loss analytic, powered by NVision Ag, gives insight into potential yield loss due to Nitrogen deficiency. Optional analytic for nitrogen management.

Variable Dry Down

variable dry down

Understand which fields and which areas of the field are drying down to help plan your harvest logistics.

Underperforming Area

low crop health

Not all areas of your fields perform the same and low NDVI doesn’t necessarily mean there is anything you can do to fix it this year. Underperforming Area alerts you to the fields and areas of the fields that are performing below their historical potential. This will allow you to quickly find those fields and areas and make adjustments to get them back on target and protect yield.

Nutrient Deficiency

nutrient deficiency

As the crop grows, it can tell us more of what is wrong with it. This analytic finds the fields and areas of the fields where there is a nutrient deficiency so that issues can be addressed before grain fill.

Disease Stress

disease risk

In conjunction with the Thermal Stress, Disease Stress alert takes into account weather information to more precisely indicate the type of stress impacting the crop.

Thermal Stress

thermal risk

Using our thermal imagery, AGMRI can detect elevated heat patterns of the crop that indicate crop stress.

Crop Health

Crop Health

Get a complete view of your farms and fields and identify where yield potential is ranked highest to the lowest.

Weed Map & Weed Escape

weed escape

Know what fields and areas of the fields have weeds. With machine integration or based on planting date, be alerted to what fields have weeds that may be impacting yield.

Historical Field Performance

AGMRI creates 5 performance zones in each field based on the historical average of those zones. This data is used to compare the current season to help understand where you are underperforming from the zone potential.

Low Emergence

low emergence

Notification of what fields and areas of the field have poor emergence.

Stand Assessment

strand assessment

AGMRI detects the established rows and uses computer vision and machine learning to determine the best segment of row and compares the rest of the field to that segment to give you a relative map. If machine data is integrated, a stand population map is returned.