DISEASE ANALYTICS WITH AGMRI
dots-horizontal

Disease Analytics with AGMRI

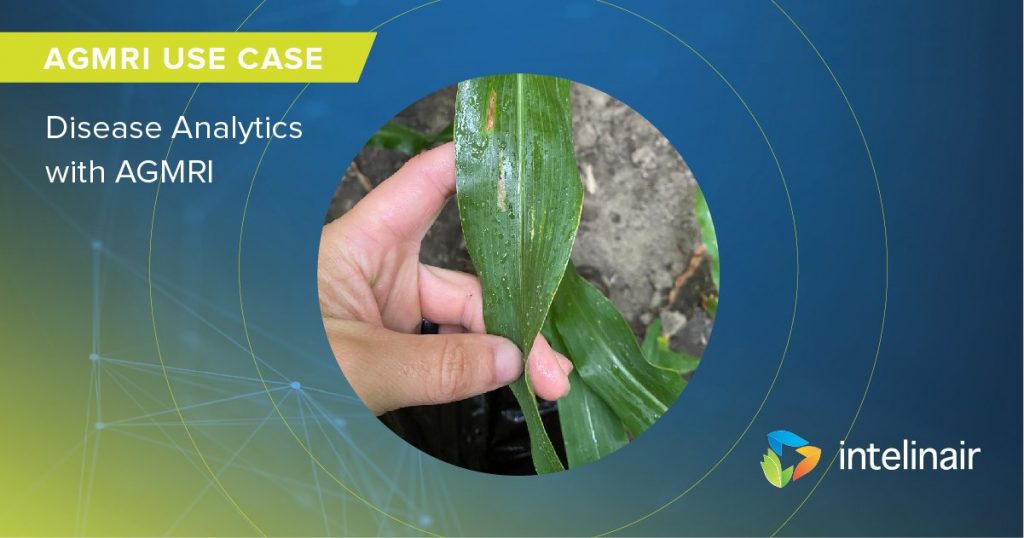
Each year, plant diseases cost the global economy around $220 billion, and invasive insects around $70 billion, according to the Food and Agriculture Organization of the United Nations. Ag retailers and farmers have an easy to use tool to help manage the threat of disease with AGMRI. The AGMRI platform evaluates fields for potential disease presence using thermal imagery mid-season. Thermal imagery detects elevated heat patterns which is a potential indicator of disease pressure. When an alert is triggered, the alert polygon can guide users to where in the field to scout for disease pressure.

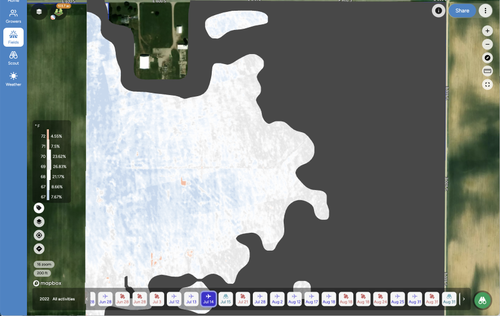
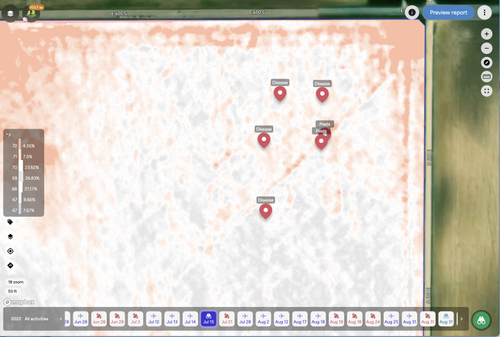
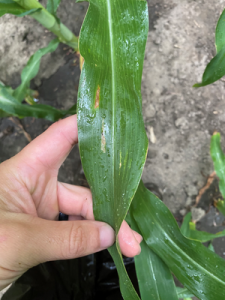
Using AGMRI, a crop advisor reviewed the thermal map that alerted the potential for disease to be present in a farmer’s field. After viewing the alert, the crop advisor scouted the field and found gray leaf spot present in the field.

Due to the disease alert, a crop advisor was able to quickly confirm disease presence, identify the disease type and severity, and develop a plan with the grower that involved a fungicide application that was not previously scheduled.


Scouting Tips: 

Use the AGMRI app to capture these observations to help a crop advisor or farmer determine the next action to take.

  1. Correctly identify the disease based upon foliar symptoms. Many universities have Crop Scouting apps or pocket guides to aid in identifying the correct disease.

  2. Determine the plant stage. This is helpful to deciding what products to use or how the disease could affect yield.

  3. Quantify the severity:

    1. Count the number of plants infected in a defined block

    2. Estimate the percent of leaf affected

    3. Review economic injury and threshold information to determine when applications are appropriate

Read more here on our field scouting blog. Contact us for more information on our disease analytics or to schedule an AGMRI demo.

Share This Article

RELATED BLOG POSTS

Yield Forecast

Understand where your corn yield is based on the current state of the crop. As the season unfolds, see how it is having an impact on your final yield.

Yield Loss

Powered by years of Nitrogen research at the University of Missouri, our corn Yield Loss analytic, powered by NVision Ag, gives insight into potential yield loss due to Nitrogen deficiency. Optional analytic for nitrogen management.

Variable Dry Down

variable dry down

Understand which fields and which areas of the field are drying down to help plan your harvest logistics.

Underperforming Area

low crop health

Not all areas of your fields perform the same and low NDVI doesn’t necessarily mean there is anything you can do to fix it this year. Underperforming Area alerts you to the fields and areas of the fields that are performing below their historical potential. This will allow you to quickly find those fields and areas and make adjustments to get them back on target and protect yield.

Nutrient Deficiency

nutrient deficiency

As the crop grows, it can tell us more of what is wrong with it. This analytic finds the fields and areas of the fields where there is a nutrient deficiency so that issues can be addressed before grain fill.

Disease Stress

disease risk

In conjunction with the Thermal Stress, Disease Stress alert takes into account weather information to more precisely indicate the type of stress impacting the crop.

Thermal Stress

thermal risk

Using our thermal imagery, AGMRI can detect elevated heat patterns of the crop that indicate crop stress.

Crop Health

Crop Health

Get a complete view of your farms and fields and identify where yield potential is ranked highest to the lowest.

Weed Map & Weed Escape

weed escape

Know what fields and areas of the fields have weeds. With machine integration or based on planting date, be alerted to what fields have weeds that may be impacting yield.

Historical Field Performance

AGMRI creates 5 performance zones in each field based on the historical average of those zones. This data is used to compare the current season to help understand where you are underperforming from the zone potential.

Low Emergence

low emergence

Notification of what fields and areas of the field have poor emergence.

Stand Assessment

strand assessment

AGMRI detects the established rows and uses computer vision and machine learning to determine the best segment of row and compares the rest of the field to that segment to give you a relative map. If machine data is integrated, a stand population map is returned.