dots-horizontal

Critical Time for Disease Development

While the potential for disease infestations this season varies given the condition of the crop, the crop growth stage, various agronomic and environmental challenges, and farmer goals, the potential impact of disease to this season’s crop cannot be overstated.  

As we know, weather and environmental conditions play a large role with disease development in both corn and soybean. And while we have seen large areas of the U.S. Midwest with lower than normal precipitation levels to this point of the season, some meteorologists are beginning to predict a possible change in the current weather conditions with higher precipitation chances in the forecast for later into July. If these forecasts materialize, the opportunity for diseases to appear in wide areas as the season lengthens will increase.  

Key Actions to be Prepared

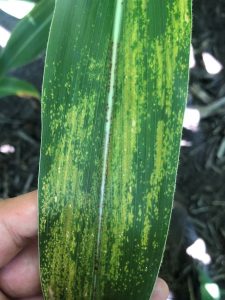
Despite the crop conditions and growth stages in some geographies, this is a key time period for disease development.

  • Be proactive in scouting activities – have a plan based upon crop rotations, field histories, field yield potential, irrigated or non-irrigated, production practices and residue management.
  • Be able to identify the key diseases for corn and soybean and have a basic knowledge of thresholds and timelines for disease development and understand economic impacts to best determine when to take appropriate actions to maintain yield potential.
  • In AGMRI, use field scouting and the thermal stress alert, combined with important weather data on a local / field basis, to direct field ground truthing to determine the crop risk and appropriate actions. Know the thermal alert patterns that are most indicative of potential disease.
  • Understand that when scheduling for any application – once a disease is identified and the treatment required is selected – that appropriate equipment availability, retailer workloads for trained applicators, and product availability could all impact your needs and a timely application. 


Contact us for more information.

Share This Article

RELATED BLOG POSTS

Yield Forecast

Understand where your corn yield is based on the current state of the crop. As the season unfolds, see how it is having an impact on your final yield.

Yield Loss

Powered by years of Nitrogen research at the University of Missouri, our corn Yield Loss analytic, powered by NVision Ag, gives insight into potential yield loss due to Nitrogen deficiency. Optional analytic for nitrogen management.

Variable Dry Down

variable dry down

Understand which fields and which areas of the field are drying down to help plan your harvest logistics.

Underperforming Area

low crop health

Not all areas of your fields perform the same and low NDVI doesn’t necessarily mean there is anything you can do to fix it this year. Underperforming Area alerts you to the fields and areas of the fields that are performing below their historical potential. This will allow you to quickly find those fields and areas and make adjustments to get them back on target and protect yield.

Nutrient Deficiency

nutrient deficiency

As the crop grows, it can tell us more of what is wrong with it. This analytic finds the fields and areas of the fields where there is a nutrient deficiency so that issues can be addressed before grain fill.

Disease Stress

disease risk

In conjunction with the Thermal Stress, Disease Stress alert takes into account weather information to more precisely indicate the type of stress impacting the crop.

Thermal Stress

thermal risk

Using our thermal imagery, AGMRI can detect elevated heat patterns of the crop that indicate crop stress.

Crop Health

Crop Health

Get a complete view of your farms and fields and identify where yield potential is ranked highest to the lowest.

Weed Map & Weed Escape

weed escape

Know what fields and areas of the fields have weeds. With machine integration or based on planting date, be alerted to what fields have weeds that may be impacting yield.

Historical Field Performance

AGMRI creates 5 performance zones in each field based on the historical average of those zones. This data is used to compare the current season to help understand where you are underperforming from the zone potential.

Low Emergence

low emergence

Notification of what fields and areas of the field have poor emergence.

Stand Assessment

strand assessment

AGMRI detects the established rows and uses computer vision and machine learning to determine the best segment of row and compares the rest of the field to that segment to give you a relative map. If machine data is integrated, a stand population map is returned.