dots-horizontal

Evaluating Down Corn with AGMRI

AGMRI uses imagery to identify down corn or stalk damage that has caused snapping, leaning, or broken plants. 

The Issue

Using AGMRI, a farmer and crop advisor viewed the aerial map and observed a test plot with several different hybrids and one specific hybrid had stalk lodging issues due to wind. Discussing the situation with the seed representative, it was determined this hybrid performs better when planted at lower populations, as higher planted populations tend to negatively affect the hybrid in the example. 

Following the observance of down corn, they collaborated with a seed representative on possible causes. It was determined the hybrid performs best under lower populations and the plot was planted at a higher population rate then recommended.   

Evaluating Down Corn With AGMRI

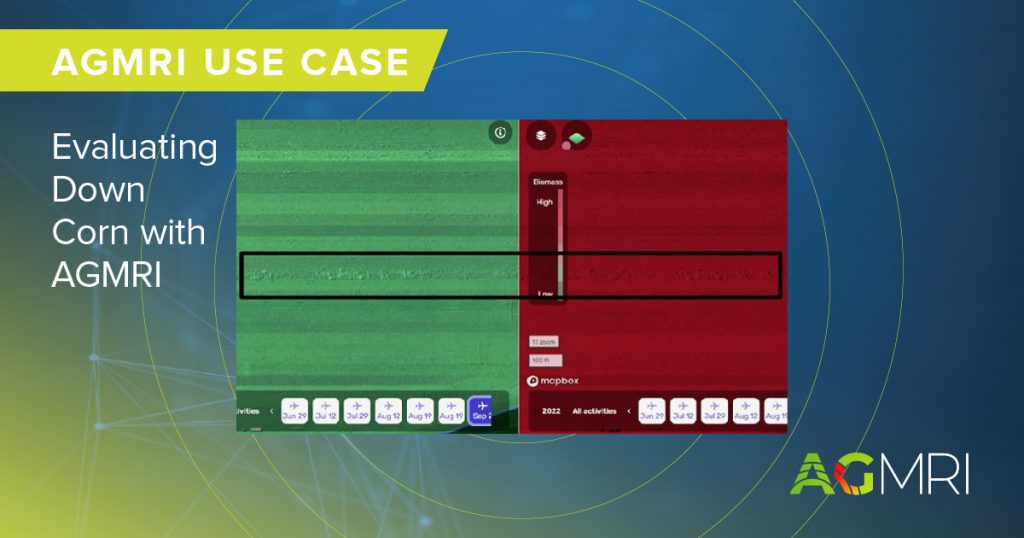
To look for down corn, start by utilizing AGMRI’s aerial imagery.  In reviewing the imagery, look for areas that have a “ruffled” appearance. The aerial image looks “ruffled” because the corn is now laying down, leaning, or bent over, and no longer in neat traditional rows.  The infrared map also will show the same “ruffled” look.

Scouting Corn Tips

When scouting corn, stalk quality issues could be due to several factors.  Consider the following to narrow down the possible cause:

  • Plant tissue with disease—The disease could have caused weak stalks, check AGMRI historical flights for disease risk
  • Visible nutrient deficiency on corn leaves
  • Breaking or snapping of the stalks 
    • Check for corresponding insect chewing
    • If the plant is actively growing, the hybrid may be vulnerable to greensnap
  • Stalk lodging versus root lodging
  • Population/Stand Count- could be too high for the soils or the chosen hybrid
  • Seeding depth – could be too shallow for proper nodal root development
  • Soil Type differences related to down corn — use AGMRI to overlay soil types to view any correlation
  • Hybrid characteristics
  • Weather issues – such as hail damage injury that can make stalks more susceptible to insect and disease damage


Contact us for more information or to schedule an AGMRI demo.

Share This Article

RELATED BLOG POSTS

Yield Forecast

Understand where your corn yield is based on the current state of the crop. As the season unfolds, see how it is having an impact on your final yield.

Yield Loss

Powered by years of Nitrogen research at the University of Missouri, our corn Yield Loss analytic, powered by NVision Ag, gives insight into potential yield loss due to Nitrogen deficiency. Optional analytic for nitrogen management.

Variable Dry Down

variable dry down

Understand which fields and which areas of the field are drying down to help plan your harvest logistics.

Underperforming Area

low crop health

Not all areas of your fields perform the same and low NDVI doesn’t necessarily mean there is anything you can do to fix it this year. Underperforming Area alerts you to the fields and areas of the fields that are performing below their historical potential. This will allow you to quickly find those fields and areas and make adjustments to get them back on target and protect yield.

Nutrient Deficiency

nutrient deficiency

As the crop grows, it can tell us more of what is wrong with it. This analytic finds the fields and areas of the fields where there is a nutrient deficiency so that issues can be addressed before grain fill.

Disease Stress

disease risk

In conjunction with the Thermal Stress, Disease Stress alert takes into account weather information to more precisely indicate the type of stress impacting the crop.

Thermal Stress

thermal risk

Using our thermal imagery, AGMRI can detect elevated heat patterns of the crop that indicate crop stress.

Crop Health

Crop Health

Get a complete view of your farms and fields and identify where yield potential is ranked highest to the lowest.

Weed Map & Weed Escape

weed escape

Know what fields and areas of the fields have weeds. With machine integration or based on planting date, be alerted to what fields have weeds that may be impacting yield.

Historical Field Performance

AGMRI creates 5 performance zones in each field based on the historical average of those zones. This data is used to compare the current season to help understand where you are underperforming from the zone potential.

Low Emergence

low emergence

Notification of what fields and areas of the field have poor emergence.

Stand Assessment

strand assessment

AGMRI detects the established rows and uses computer vision and machine learning to determine the best segment of row and compares the rest of the field to that segment to give you a relative map. If machine data is integrated, a stand population map is returned.