dots-horizontal

Five Things You Might Not Know AGMRI Can Do

Many growers and agronomists know AGMRI as a crop intelligence platform used for field monitoring with high-resolution aerial imagery. But the platform supports far more than simple crop monitoring.

AGMRI combines imagery analysis, disease risk modeling, and field insights to help growers and agronomists identify issues earlier, prioritize scouting, and make better management decisions throughout the growing season.

Whether you’ve been using AGMRI for years or are just getting started, here are five capabilities you may not have fully explored yet. 

1

Identify and Forecast Disease Risk

AGMRI helps agronomists and growers identify and forecast disease risk in corn and soybean fields by tracking environmental conditions throughout the season.

The platform monitors and accumulates risk for six major corn and soybean diseases, helping users recognize when disease pressure is building and when intervention may be most effective.


With disease risk insights available throughout the season, users can:

  • Monitor disease risk trends across fields
  • Identify optimal windows for treatment decisions
  • Act before visible symptoms impact crop yield

This proactive approach helps agronomists and growers manage disease risk earlier and more effectively.

2

Catch Crop Issues Earlier

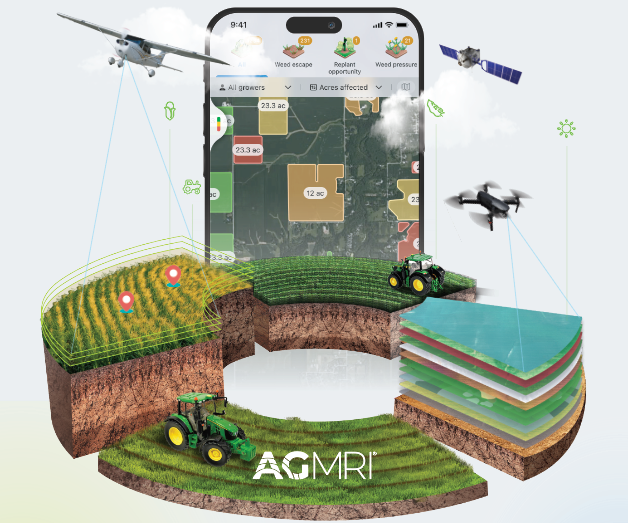
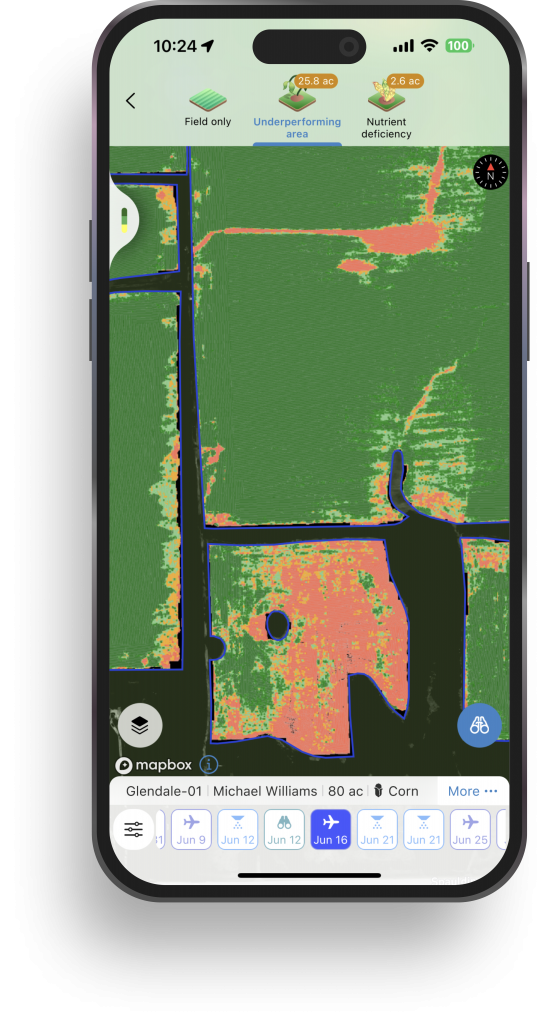
AGMRI analyzes high-resolution aerial imagery of crop fields to detect subtle changes in crop health. These early indicators of crop stress often appear before problems are visible during field scouting, allowing agronomists and growers to identify emerging issues sooner.

Earlier visibility helps teams:

    • Prioritize scouting locations
    • Investigate crop stress sooner
    • Respond more quickly to developing field problems

Early detection allows growers to address small problems before they expand across a field.

3

Turn Insights into Actionable Zones

AGMRI transforms crop imagery and analytics into clear management zones within a field.

Instead of interpreting imagery manually, users can quickly identify:

  • High-performing crop areas
  • Underperforming zones
  • Patterns related to soil variability, drainage, or management practices

These insights support more targeted field management strategies, including:

  • Variable rate input applications
  • Targeted crop scouting
  • Prioritizing field visits

By translating imagery into actionable zones, AGMRI helps turn field data into practical decisions.

4

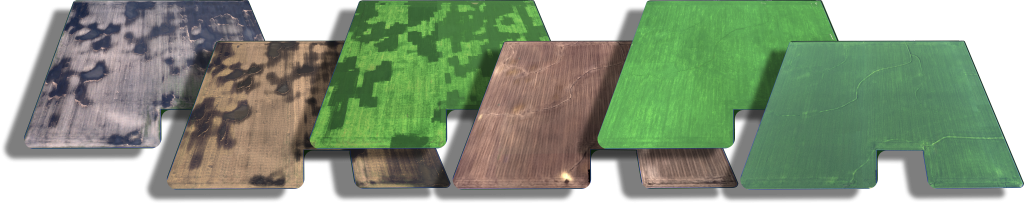
Track Field Performance Over Time

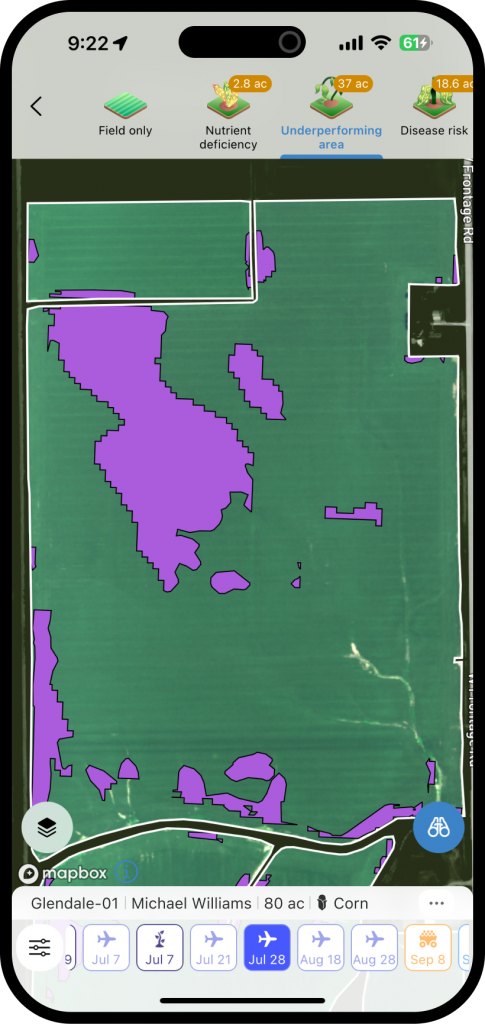
Crop conditions change rapidly during the growing season. AGMRI provides continuous field monitoring and crop health insights, enabling growers and agronomists to track how conditions evolve over time.

Season-long insights allow users to:

  • Compare crop conditions week to week
  • Monitor crop development and progress
  • Evaluate how fields respond to weather events or management decisions

Tracking these patterns over time helps reveal what factors are influencing field performance and yield potential.

5

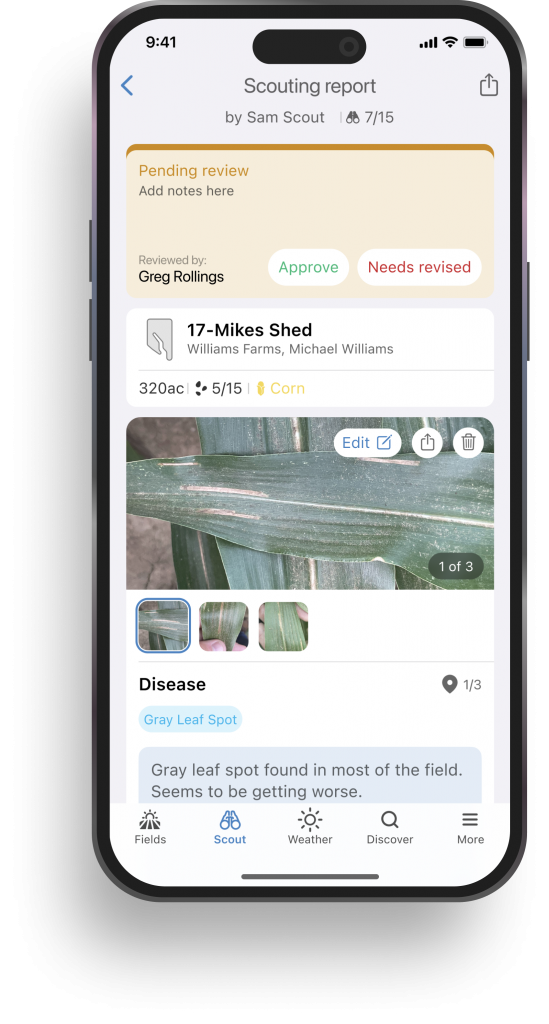
Scout and Collaborate Better

AGMRI helps growers and agronomists scout fields more efficiently by identifying where attention is needed most.

Instead of walking entire fields, users can pinpoint areas showing signs of stress and scout those locations first.

The platform also improves collaboration by allowing growers, agronomists, and advisors to review the same imagery and field insights when discussing crop conditions.

This makes it easier to:

  • Focus scouting on priority areas
  • Share observations with advisors and agronomists
  • Align quickly on management decisions

Unlocking the Full Value of AGMRI

AGMRI is designed to support crop management decisions throughout the growing season—from early crop development through post-season evaluation and planning.

By combining imagery, crop health analysis, and disease risk insights, the platform helps growers and agronomists better understand field conditions and respond more effectively.

These five capabilities represent just a few ways AGMRI can support more informed field management.

To learn more about how AGMRI can support your operation, contact us.

Share This Article

RELATED BLOG POSTS

[pdf-embedder url=”https://www.intelinair.com/wp-content/uploads/2024/10/Topography-Layer.pdf”

Yield Forecast

Understand where your corn yield is based on the current state of the crop. As the season unfolds, see how it is having an impact on your final yield.

Yield Loss

Powered by years of Nitrogen research at the University of Missouri, our corn Yield Loss analytic, powered by NVision Ag, gives insight into potential yield loss due to Nitrogen deficiency. Optional analytic for nitrogen management.

Variable Dry Down

variable dry down

Understand which fields and which areas of the field are drying down to help plan your harvest logistics.

Underperforming Area

low crop health

Not all areas of your fields perform the same and low NDVI doesn’t necessarily mean there is anything you can do to fix it this year. Underperforming Area alerts you to the fields and areas of the fields that are performing below their historical potential. This will allow you to quickly find those fields and areas and make adjustments to get them back on target and protect yield.

Nutrient Deficiency

nutrient deficiency

As the crop grows, it can tell us more of what is wrong with it. This analytic finds the fields and areas of the fields where there is a nutrient deficiency so that issues can be addressed before grain fill.

Disease Stress

disease risk

In conjunction with the Thermal Stress, Disease Stress alert takes into account weather information to more precisely indicate the type of stress impacting the crop.

Thermal Stress

thermal risk

Using our thermal imagery, AGMRI can detect elevated heat patterns of the crop that indicate crop stress.

Crop Health

Crop Health

Get a complete view of your farms and fields and identify where yield potential is ranked highest to the lowest.

Weed Map & Weed Escape

weed escape

Know what fields and areas of the fields have weeds. With machine integration or based on planting date, be alerted to what fields have weeds that may be impacting yield.

Historical Field Performance

AGMRI creates 5 performance zones in each field based on the historical average of those zones. This data is used to compare the current season to help understand where you are underperforming from the zone potential.

Low Emergence

low emergence

Notification of what fields and areas of the field have poor emergence.

Stand Assessment

strand assessment

AGMRI detects the established rows and uses computer vision and machine learning to determine the best segment of row and compares the rest of the field to that segment to give you a relative map. If machine data is integrated, a stand population map is returned.

YOUR MESSAGE WAS SENT SUCCESSFULLY!

dots-horizontal

We have received your inquiry and we’ll be in touch with you soon

Thank you for contacting us.