dots-horizontal

Field Health Guides Timely Fungicide Application

Background

A corn and soybean farmer in Indiana found himself at a crossroads regarding a crucial decision – whether to apply fungicide to a river bottom field in July. This irrigated field was particularly susceptible to diseases, especially with consecutive corn crops (corn after corn) and the looming threat of tar spot. The decision was further complicated by concerns about unpredictable weather patterns and the potential return on investment (ROI).

The grower had a history of applying fungicide across his acres but hesitated this year due to concerns about crop quality, health, and future ROI. Despite the challenges posed by factors like irrigation and consecutive corn cropping, the field in question appeared to be in better shape compared to the four-year average.

Challenge

The challenge had the potential to escalate if not addressed. The grower grappled with uncertainty about whether the field would yield a satisfactory ROI, considering the volatile weather patterns. Failing to take action could have resulted in yield losses, given the field’s vulnerability to diseases, especially in the context of consecutive corn cropping and irrigation.

The grower contemplated forgoing fungicide application across all his acres, although most were irrigated. Ultimately, he decided to invest in protecting the field’s health and potential, viewing it as insurance against stalk degradation, disease pressure, drought, and other risks.


Solution

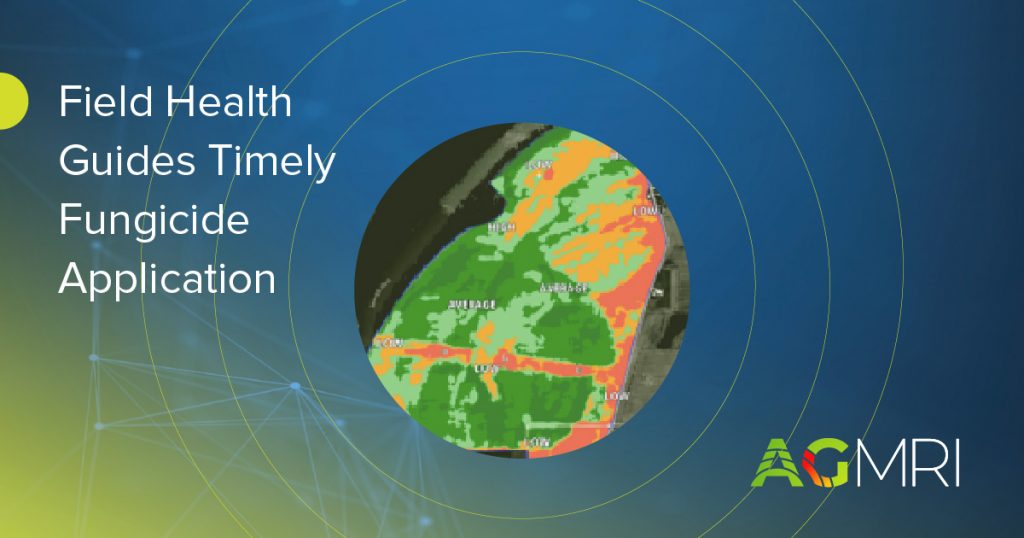
AGMRI played a pivotal role in resolving this challenge by providing essential insights. It compared the current field health with a four-year average, offering valuable data for decision-making. AGMRI’s comprehensive field health map, rather than relying on a single point, was instrumental in this process. The use of NDVI and historical crop health data saved valuable time that would have otherwise been spent on field scouting.

The comparison between the field health map and the historic field health map, along with the inclusion of examples from the previous year (2022), showcased the improved health and potential of the 2023 corn crop compared to the last four years.

Results

The outcome was a timely fungicide application that significantly improved the crop’s health in the field. The grower’s experience with AGMRI is likely to shape future decisions and field prioritization. The application not only safeguarded the current crop but also preserved the field’s yield potential, underscoring AGMRI’s value in optimizing crop management decisions.


View the Full Use Case

Share This Article

RELATED BLOG POSTS

Yield Forecast

Understand where your corn yield is based on the current state of the crop. As the season unfolds, see how it is having an impact on your final yield.

Yield Loss

Powered by years of Nitrogen research at the University of Missouri, our corn Yield Loss analytic, powered by NVision Ag, gives insight into potential yield loss due to Nitrogen deficiency. Optional analytic for nitrogen management.

Variable Dry Down

variable dry down

Understand which fields and which areas of the field are drying down to help plan your harvest logistics.

Underperforming Area

low crop health

Not all areas of your fields perform the same and low NDVI doesn’t necessarily mean there is anything you can do to fix it this year. Underperforming Area alerts you to the fields and areas of the fields that are performing below their historical potential. This will allow you to quickly find those fields and areas and make adjustments to get them back on target and protect yield.

Nutrient Deficiency

nutrient deficiency

As the crop grows, it can tell us more of what is wrong with it. This analytic finds the fields and areas of the fields where there is a nutrient deficiency so that issues can be addressed before grain fill.

Disease Stress

disease risk

In conjunction with the Thermal Stress, Disease Stress alert takes into account weather information to more precisely indicate the type of stress impacting the crop.

Thermal Stress

thermal risk

Using our thermal imagery, AGMRI can detect elevated heat patterns of the crop that indicate crop stress.

Crop Health

Crop Health

Get a complete view of your farms and fields and identify where yield potential is ranked highest to the lowest.

Weed Map & Weed Escape

weed escape

Know what fields and areas of the fields have weeds. With machine integration or based on planting date, be alerted to what fields have weeds that may be impacting yield.

Historical Field Performance

AGMRI creates 5 performance zones in each field based on the historical average of those zones. This data is used to compare the current season to help understand where you are underperforming from the zone potential.

Low Emergence

low emergence

Notification of what fields and areas of the field have poor emergence.

Stand Assessment

strand assessment

AGMRI detects the established rows and uses computer vision and machine learning to determine the best segment of row and compares the rest of the field to that segment to give you a relative map. If machine data is integrated, a stand population map is returned.