Background
An Indiana corn grower works in partnership with a local cooperative for much of his seed needs. He also relied on the cooperative’s trusted advisors to provide agronomic and scouting services through the growing season.
Challenge
 The year 2023 proved to be a challenging one for farmers due to early planting opportunities followed by an extreme drought. Achieving uniform crop emergence was difficult, and weed persistence added to the challenges faced by most farms.
Amidst these difficulties, operational issues were at risk of being overlooked. This grower, overseeing a scouting team, prioritized the acres with the highest potential for improvement. He also managed a couple of irrigation pivots; operating them efficiently was important given the significant cost of running them in such a dry area where irrigators were working harder than usual.
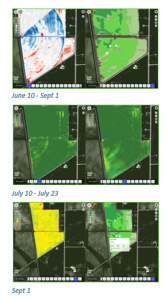
On June 10, the cooperative advisor noticed an irregular pattern in one of the field’s irrigation pivots using AGMRI’s thermal map layer. The southern pivot displayed a red streak, indicating a higher surface temperature, which suggested an inefficient spray pattern. The advisor immediately contacted the grower to alert him to this potential issue. The grower was unaware of the issue but promptly investigated. Upon closer inspection, they found that a few nozzles on the pivot were clogged.
Even after the repair, the affected crop rows lagged in health for most of the growing season. In July, the grower used the AGMRI VEG map to monitor the progression and crop health of this area, hoping it would catch up. He took a deeper dive into assessing the potential loss in this specific situation. Using AGMRI’s Yield Forecast tool, he pinpointed the exact spot where the nozzle had an issue. This area showed an average loss of about 40 bushels. To further quantify the impact, he conducted a manual yield check in the affected area, revealing a roughly 45-bushel yield loss.
Solution
By leveraging AGMRI, the grower successfully managed their irrigation system to mitigate yield loss. Without the comprehensive imagery and insights provided by AGMRI, detecting this issue would have required many hours of scouting. In such a scenario, the loss might have been too significant to recover.
Given the vast size of the field and its remote location, traditional scouting methods were impractical. The thermal map layer and VEG map provided real-time insights that would have otherwise been challenging to obtain. The thermal map layer was instrumental in quickly identifying the inefficient spray pattern across acres, not just in a single row. This was especially valuable when crops were tall and tracking spray patterns manually was difficult.
Moreover, the use of AGMRI’s Yield Forecast tool allowed for precise pinpointing of the issue’s impact on crop yield. This data-driven approach provided critical information for decision-making and resource allocation.
Results
The prompt response to AGMRI insights enabled the rapid repair of the irrigation system, specifically targeting the problematic pivot section. This timely intervention potentially saved a substantial yield loss. The experience underscored the value of AGMRI in diagnosing and addressing critical agricultural issues efficiently, ultimately protecting yield potential and better resource management for the grower.


