dots-horizontal

Low Crop Health in Unique Pattern Leads to Investigation

Background

In Northwest Iowa, a historically corn and soybean rotation field experienced a few challenges in recent years. In 2020 the grower saw poor corn yields in specific areas, which the grower attributed to dry weather conditions. In the fall of 2021, some terraces were removed. In 2022, the grower started monitoring their fields with AGMRI and noticed a recurring pattern of poor crop health in those same areas.

Challenge

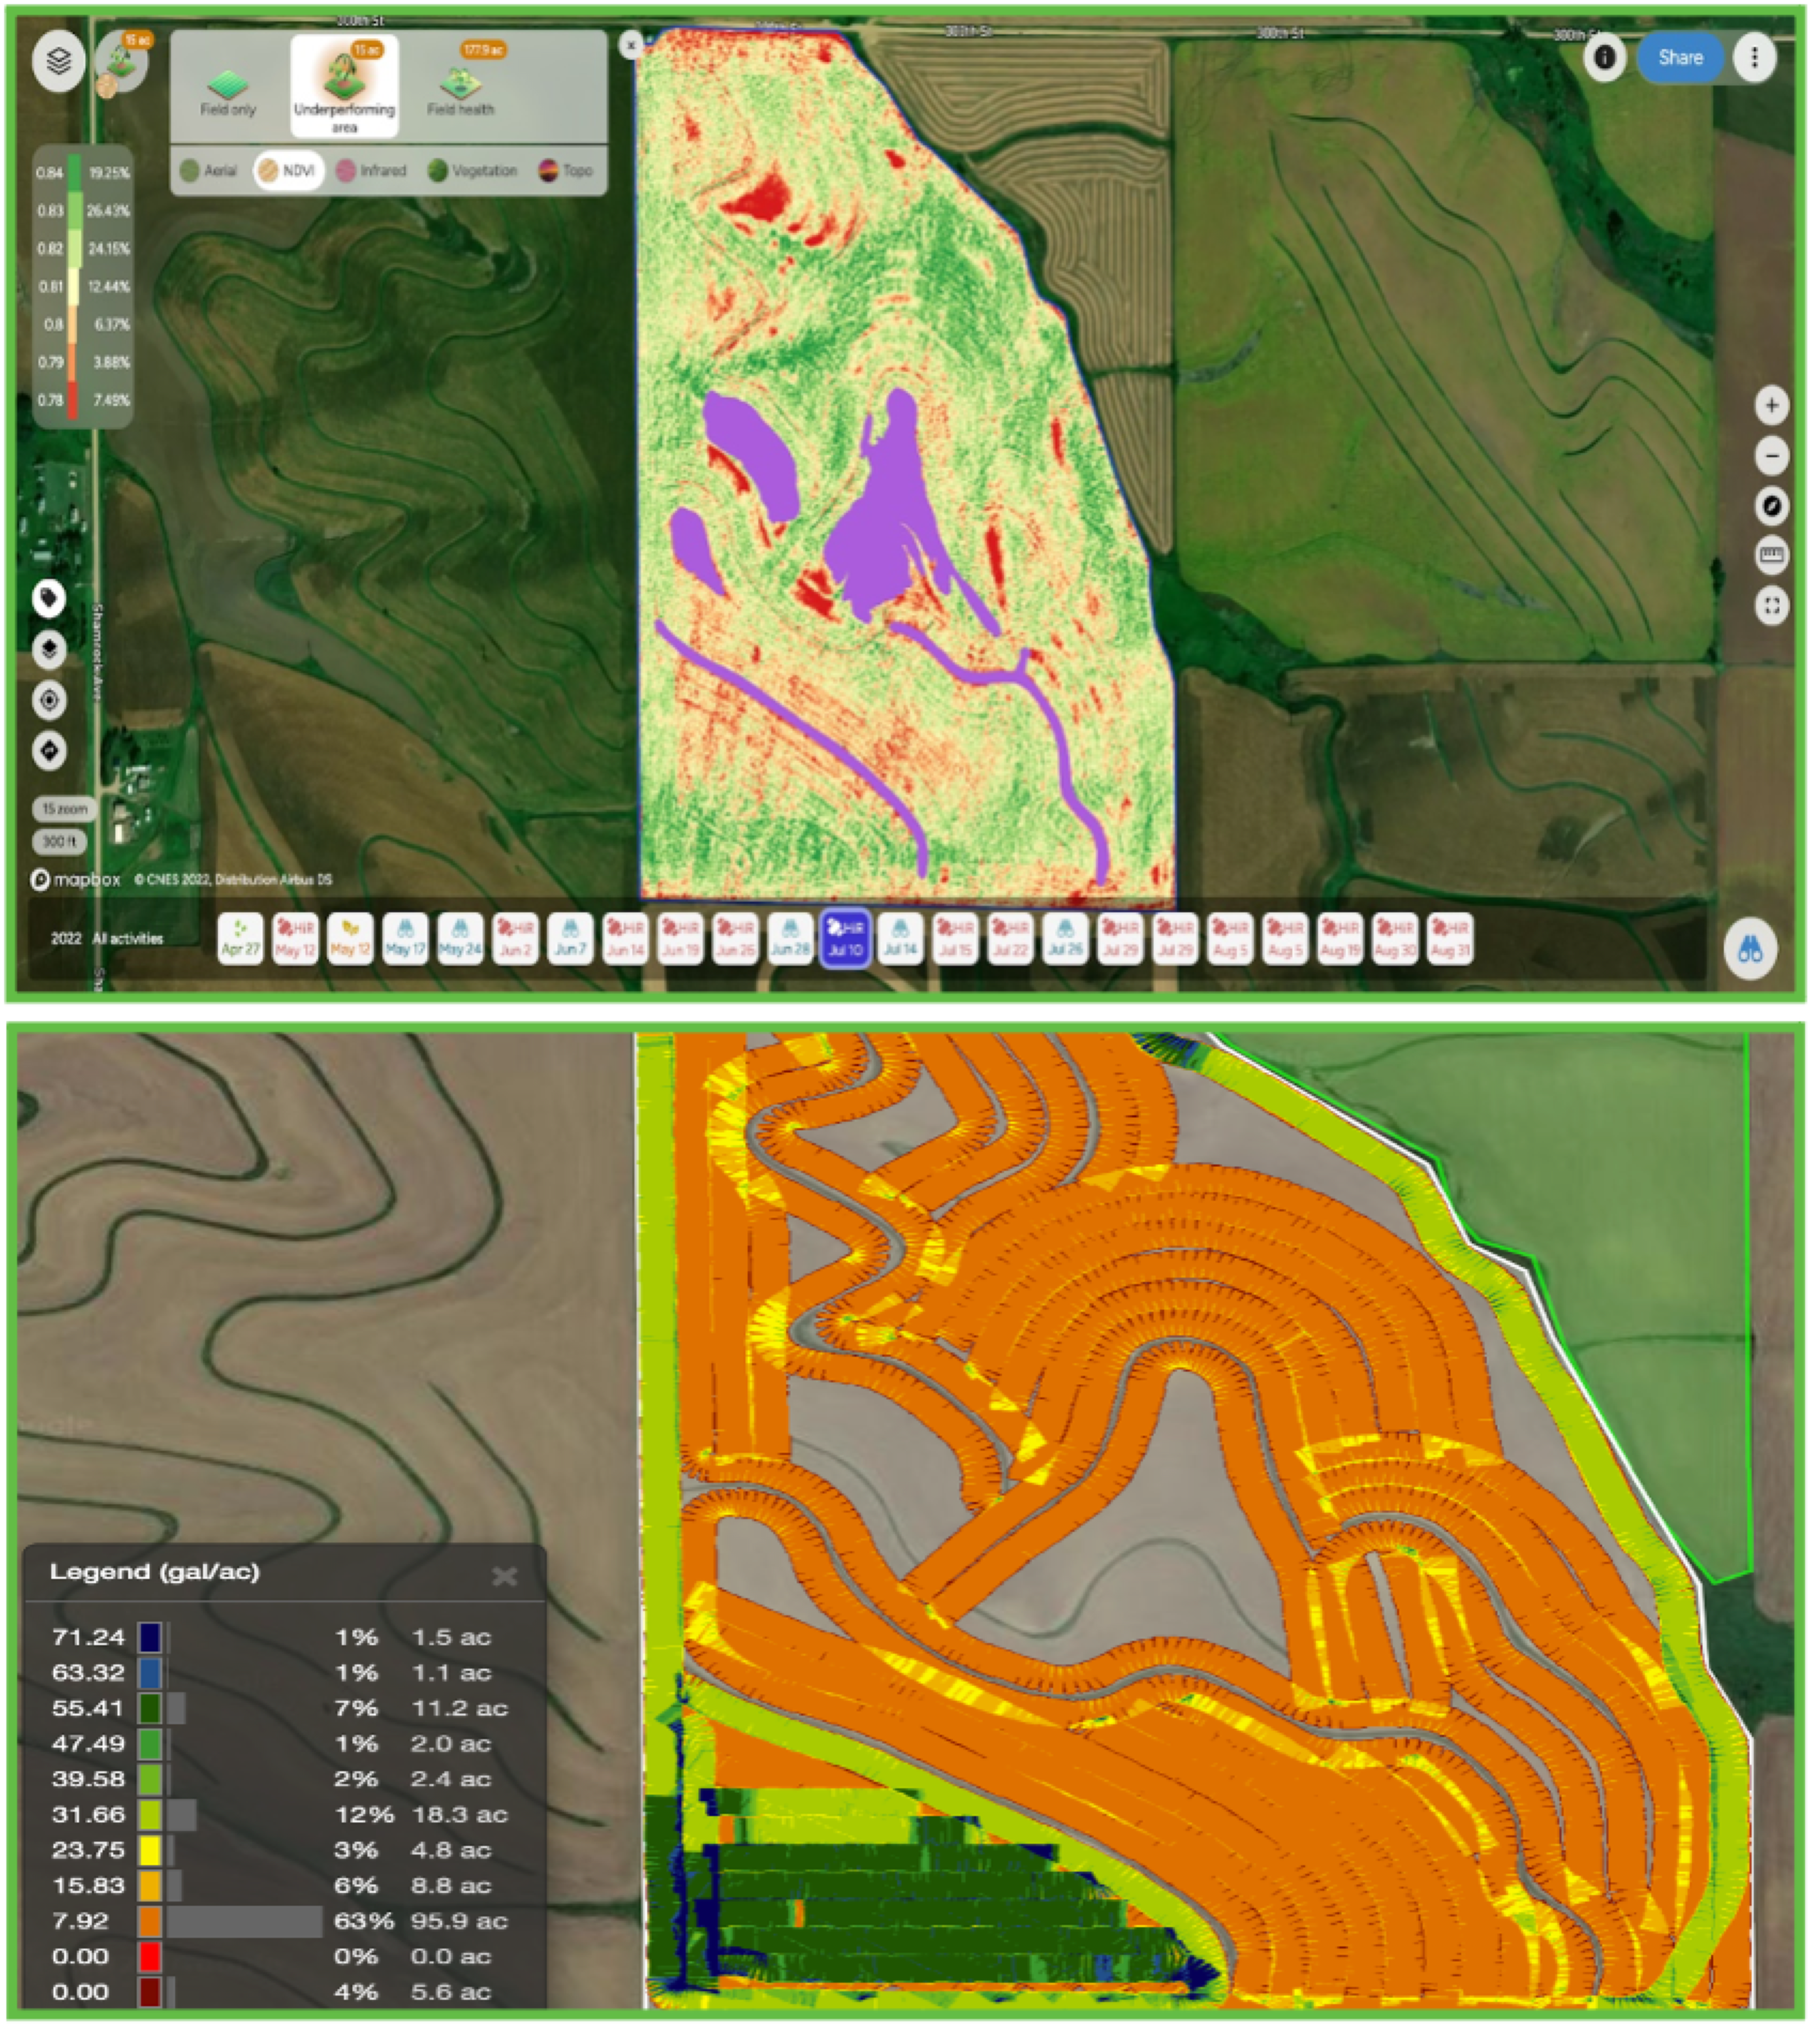
The grower’s main concern was understanding the cause of the recurring poor crop health pattern.

They were unsure whether the issue was related to the removal of terraces, missed nitrogen application, or some other factor. The yield monitor showed poor performance in these areas in 2020, and the grower was worried about the potential yield loss if the issue remained unresolved. The grower was “on the fence” about what action to take and needed a way to validate and evaluate the situation. They used AGMRI to analyze satellite imagery and identify the patterns in the field.

Solution

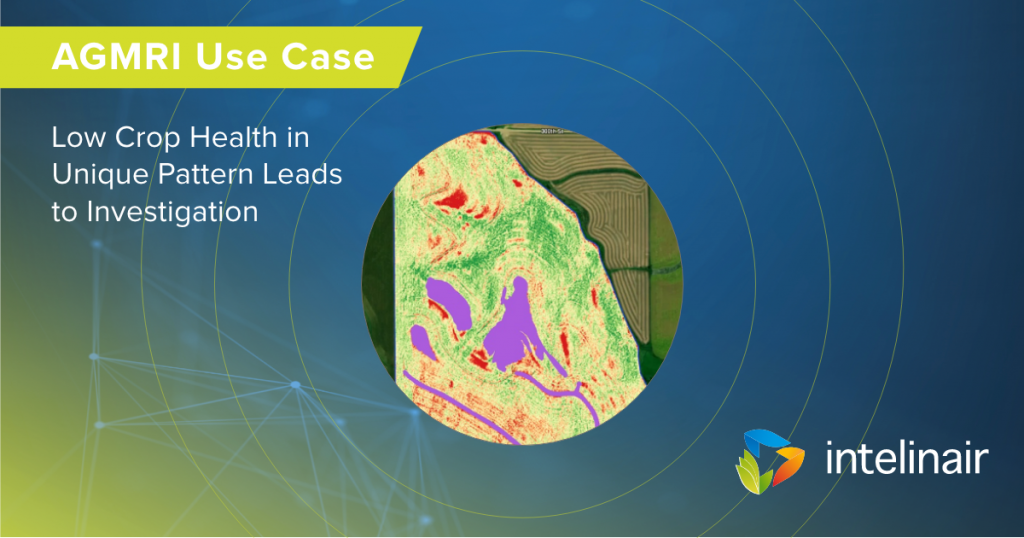
AGMRI played a crucial role in helping the grower address the issue. Initially, they suspected the terrace removal might be causing the problem, but further investigation ruled this out as the pattern mostly occurred above the old terraces. Then, the grower considered a missed nitrogen application as the reason for poor crop health. After consulting with their agronomist and reviewing the AGMRI images, they shifted their focus to potential Potassium or Phosphorus deficiencies. In referencing the RGB map, they observed “silver” looking corn and the NDVI of low vegetation in those areas. AGMRI prompted the grower to revisit their application data, and they discovered a map of the P&K application from the spring of 2020, which confirmed the missed application. This discovery led to targeted corrective action.

Results

Upon discovering the missed P&K application in certain areas, the grower applied a higher rate of P&K in the fall of 2023 to address the deficiency. As a result, they mitigated the issue and improved the health of the crops in those areas. Analytics revealed these missed areas had a significant impact, resulting in a yield loss of 48 bushels per acre at a rate of $6 per bushel, amounting to a financial loss of $3,570 for this one field. This experience emphasized the importance of data-driven decision-making and the value of using AGMRI to identify and rectify crop health issues. In the future, the grower plans to continue using AGMRI to monitor and prioritize their fields during critical times, ensuring more efficient and productive crop management.


View the Full Use Case

Share This Article

RELATED BLOG POSTS

Yield Forecast

Understand where your corn yield is based on the current state of the crop. As the season unfolds, see how it is having an impact on your final yield.

Yield Loss

Powered by years of Nitrogen research at the University of Missouri, our corn Yield Loss analytic, powered by NVision Ag, gives insight into potential yield loss due to Nitrogen deficiency. Optional analytic for nitrogen management.

Variable Dry Down

variable dry down

Understand which fields and which areas of the field are drying down to help plan your harvest logistics.

Underperforming Area

low crop health

Not all areas of your fields perform the same and low NDVI doesn’t necessarily mean there is anything you can do to fix it this year. Underperforming Area alerts you to the fields and areas of the fields that are performing below their historical potential. This will allow you to quickly find those fields and areas and make adjustments to get them back on target and protect yield.

Nutrient Deficiency

nutrient deficiency

As the crop grows, it can tell us more of what is wrong with it. This analytic finds the fields and areas of the fields where there is a nutrient deficiency so that issues can be addressed before grain fill.

Disease Stress

disease risk

In conjunction with the Thermal Stress, Disease Stress alert takes into account weather information to more precisely indicate the type of stress impacting the crop.

Thermal Stress

thermal risk

Using our thermal imagery, AGMRI can detect elevated heat patterns of the crop that indicate crop stress.

Crop Health

Crop Health

Get a complete view of your farms and fields and identify where yield potential is ranked highest to the lowest.

Weed Map & Weed Escape

weed escape

Know what fields and areas of the fields have weeds. With machine integration or based on planting date, be alerted to what fields have weeds that may be impacting yield.

Historical Field Performance

AGMRI creates 5 performance zones in each field based on the historical average of those zones. This data is used to compare the current season to help understand where you are underperforming from the zone potential.

Low Emergence

low emergence

Notification of what fields and areas of the field have poor emergence.

Stand Assessment

strand assessment

AGMRI detects the established rows and uses computer vision and machine learning to determine the best segment of row and compares the rest of the field to that segment to give you a relative map. If machine data is integrated, a stand population map is returned.