Background
A central Indiana farmer growing field corn, seed corn, soybeans, and specialty crops including pumpkins. While he and his farm manager closely manage the high-priority seed corn, the other crops often take a lower priority. This ongoing time management challenge can make it easy to overlook weed escapes.
Midway through the season, the farm faced a significant weed management challenge due to exceptionally dry weather, which posed a particular threat to soybean yield.
 Challenge
Weed management, though considered a lower-level issue compared to weather-related challenges or diseases, became a pressing concern for this farmer. With the weather pattern being unusually dry, the farm struggled to control weeds effectively, even after applying herbicides. The herbicide’s limited effectiveness was attributed to the lack of moisture required to activate its residual properties. This presented a risk of yield loss for his soybean crop. However, the greater concern was the potential for these weeds to produce seeds, exacerbating the problem in the following growing season.
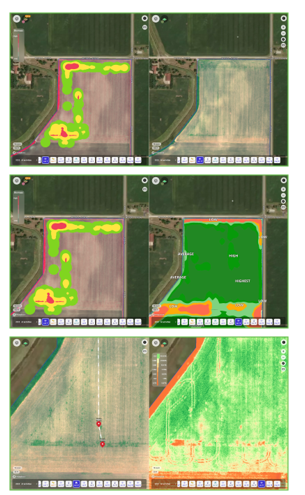
Keeping an eye on the progression from the June 7 smart alert showed the post application was not successful. Weed clusters continued to grow (as seen on June 17 map). The increased vegetation on the aerial and infrared map was enough to trigger a scouting visit. Upon investigation – grasses and waterhemp were growing aggressively.
AGMRI’s aerial and NDVI mapping alerted the farm to early weed pressure in the area, prompting further investigation in the impacted areas. The challenge was not only identifying the issue but also quantifying its extent during the busy season.
Solution
While this farmer had been using AGMRI primarily for tracking equipment improvements over the past two years, AGMRI played a crucial role in addressing the weed management challenge. It drew attention to the specific field with weed issues, leading to the deployment of a scout to gather timely information on resistant weeds. The timeline feature provided insights into when weed management efforts were unsuccessful throughout the season. Since late season weed pressure is tough to evaluate, measuring tools in AGMRI were used to quantify the acres affected. Using NDVI, poor reflectivity zones (red blotches) were identified where the crop should have been growing. These insights provided a better understanding of the potential yield loss.
To resolve the issue, the farmer decided to use a different herbicide to eliminate the remaining weeds effectively. Once the third application was made, the weeds were eliminated. Multiple captures by AGMRI revealed the late-season impact on the crop and, importantly, assured the grower that the weeds were eliminated before seeding.
Results
Thanks to AGMRI, the farm implemented an additional herbicide pass, wiping out the remaining weeds. The benefits of this decision will manifest in the following season, with reduced weed pressure and likely a more successful soybean crop. Going forward, AGMRI will continue to play a vital role in managing weed pressure to prevent similar situations in the future, enhancing the farm’s overall productivity and profitability.


