
Background
A central Indiana grower faced challenges related to corn residue disbursement. Harvesting with a 30 ft corn head, he suspected that the chaff spreader was creating residue strips but wasn’t sure about the extent of the problem or the potential return on investment (ROI) of improving the chaff spreader, which costs around $30,000.
This grower had been struggling with inconsistent soybean emergence for several seasons when planting into corn residue. Without using tillage to break up the residue, he was seeking less invasive solutions to address this issue. He was aware that a chaff spreader could help but was concerned about the cost.
Additionally, he was exploring the possibility of using biologicals to support residue breakdown as a more cost-effective alternative.
Challenge
The challenge for this grower is the poor emergence of soybeans due to corn residue accumulation in the center of combine passes. He needed to quantify the extent of this issue and determine whether investing in a new chaff spreader or exploring alternative biological solutions would yield a positive ROI.
Solution
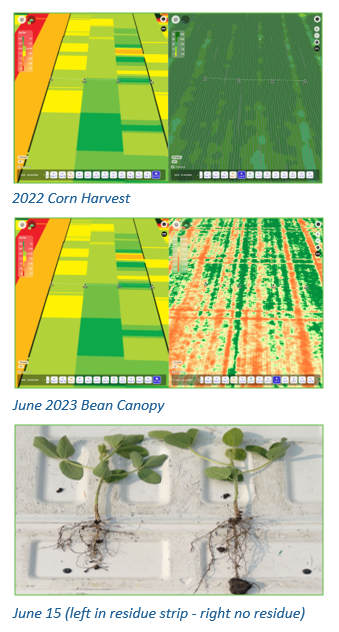
AGMRI provided invaluable assistance in addressing his challenge. The platform identified areas of low emergence within corn harvest passes using imagery. Measuring tools were employed to represent the 30 ft width of prior year harvest maps. These points were then transferred onto the current date emergence and vegetation maps to highlight gaps in the stand. NDVI data were used to assess mid-season canopy closure. AGMRI’s scouting app helped replicate sample locations, and harvest data was analyzed to understand yield potential.
Through these tools, it became evident that corn residue accumulation in the middle of combine passes was causing poor soybean emergence. This information led to a study to test the theory that investing in a new chaff spreader would increase yield and result in a positive ROI.
Results
Scouting efforts compared areas with heavy residue strips to those with less residue. The findings were striking – in areas with heavy residue strips, the average pods per plant were 51, while in areas with less residue, the average pods per plant increased to 66.
This revealed that the residue strips were costing approximately 15 pods per plant in terms of yield. The grower acknowledged that AGMRI’s insights have been crucial in assessing year-over-year residue impact, informing his future decisions regarding equipment improvements and potential biological solutions.
He is actively considering an equipment change but hasn’t made a final decision yet, pending further analysis of the results. Additionally, he is exploring the use of biological products and similar options to offer secondary solutions to address the residue issue.


