Last week, I had the opportunity to review corn and soybean fields in Indiana and Illinois. This has been an interesting growing season, so I wanted to share a few highlights from my field visits.
Soybean Highlights
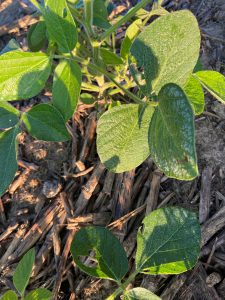
For soybeans, the fields were fairly uniform in terms of growth stage – remember, we are past the summer solstice, June 21, so the fields were primarily at growth stage R1, Beginning Bloom or ‘flowering,’ as it is commonly said. Another observation is that I saw the differences in canopy closure between 30” rows and other, narrower row width plantings. Trials over many seasons have shown a loss in yield potential for soybeans when the rows have not ‘closed over’ by early July. As well, some of the fields had received some significant rainfall, so that is a good thing for the crop potential as the soybeans enter their key reproductive stages. Continued moderate temperatures and precipitation, from now into August or even early September, will be key to success for the soybean crop in many of our areas.
Corn Highlights
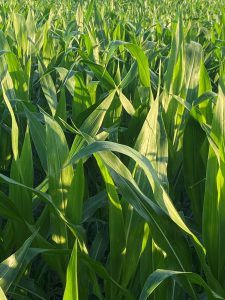
For corn, in general, I was struck by the degree of how uneven the crop was in terms of its overall physiological development. Differences in plant height, growth sage and even in the overall development of tassels and then silks, were apparent in many fields. As I walked and reviewed the fields, I thought back to early spring and the start of the season and wondered ‘why?’.
Here is my perspective and ideas on ‘why?’
- While we had adequate soil moisture at planting time in many areas, the unevenness in emergence and early development due to the rate at which the soils dried out, has played a part in the way the crop looks today regarding its unevenness in some areas.
- Shallow planting, or shallower than I would have anticipated given the conditions, coupled with the quick drying out of soils, resulted in an overall lack of root development early in the season.
- The variations in soil moisture available gave us a scenario where the access to both moisture and nutrients varied on a plant by plant basis, leading to the uneven development that we see today.
- Fields where crop residues helped to maintain soil moisture to a greater extent and those fields that had started fertilizer applications appear to be more uniform, at least to my eyes.
A Look Back at Mid-Season – What Does it Mean?
While this might be a good recap, or ‘look back,’ from this point in the season, what might it mean going forward, particularly for corn?
Besides successful stand establishment, successful pollination is the next critical step in obtaining yield from a corn crop. Corn tassels exert at growth stage VT, and then the silks begin to emerge at the first reproductive stage, R1. The synchronization between these two growth stages are key to building yield potential.
Generally, tassels will ‘shed’ pollen for about 7 – 10 days, while silks are ‘receptive’ to pollen for about 10 days, although they are most viable up to 5 days or so. The silks grow, or ‘elongate’ from the tip of the ear at the rate of about 1.5” per day. The individual ‘grains’ of corn pollinate from the base of the ear upwards to the tip and this occurs in about 3 – 5 days depending upon conditions. To say that the week around pollination is the key to the potential of the crop is an understatement.
And, all of this physiological development in an uneven corn crop is what makes me wonder how the crop will turn out in the individual fields I walked, and with the many fields that I see the same conditions in today.
Also concerning will be any disease or insect infestations at this stage of the crop’s life cycle.
While there are and will be fields with very good yield potential – even emergence, good root development, minimal nutrient availability and soil moisture concerns, and with even pollination – these certainly will be noted at harvest time. Others, with varying degrees of challenges listed, will be challenged to meet expectations.
When will we know the impact of all of these scenarios?
Crop tours and field visits to determine potential are generally best after crop stages R4 – Dough stage / R5 – Dent stage. One can begin to look earlier, but at these growth stages any kernel abortion and any issues with grain fill are pretty well known. The remaining potential impact of an early frost on late developing / uneven corn would be seen at that point of the season.
It is always interesting to me to ‘look back’ and understand the ‘why’ of how we got to this point with crop development to date, and to ‘look forward’ and try to understand ‘what could be. Of course, at a future date in about 4 – 6 weeks, I’ll have a chance to look at the crop and how it has played out, at which time I will have a new set of data points and questions as to how we got where we are!


