dots-horizontal

Illinois Grower Averts Potential Yield Loss from Nitrogen Deficiency with AGMRI

Background

In Western Illinois, a grower was faced with a challenging field with high elevation and steep slopes. The southern half of the field was designated as no-till and had experienced setbacks throughout the year.

Challenge

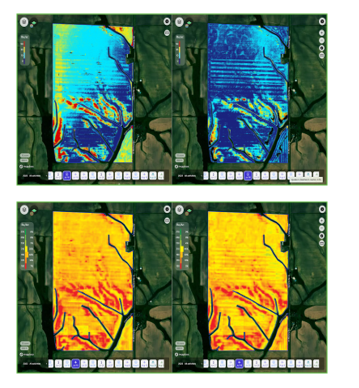
The grower faced a significant challenge when an NVision Ag analysis through AGMRI revealed a nitrogen deficiency in the field. This deficiency was particularly severe on the no-till portion of the field and the slopes, raising concerns about the impact on overall crop productivity.

Solution

To combat the nitrogen deficiency issue, the grower turned to AGMRI for a deeper dive into the analytics. Based on AGMRI’s data, the grower made the decision to supplement the existing application with foliars and micronutrients. This proactive approach aimed to alleviate the severity of the nitrogen deficiency and mitigate potential yield loss.

Results

The results were remarkable and provided a testament to the effectiveness of AGMRI’s solution. Five days after the application on July 21, both NVision Ag and AGMRI’s yield forecast exhibited an immediate improvement, projecting an increase of up to 8 bushels. The grower’s decision to act upon AGMRI’s data not only averted potential yield loss but also demonstrated the results of data-driven decision-making tools on the farm.

AGMRI helped the grower to make an informed decision that not only mitigated yield loss but also improved crop productivity. The data-driven approach also ensured optimal resource allocation.

The grower plans to continue utilizing AGMRI’s insights to enhance crop management and optimize yields, underscoring the positive impact on productivity and potential return on investment (ROI).


View the Full Use Case

Share This Article

RELATED BLOG POSTS

Yield Forecast

Understand where your corn yield is based on the current state of the crop. As the season unfolds, see how it is having an impact on your final yield.

Yield Loss

Powered by years of Nitrogen research at the University of Missouri, our corn Yield Loss analytic, powered by NVision Ag, gives insight into potential yield loss due to Nitrogen deficiency. Optional analytic for nitrogen management.

Variable Dry Down

variable dry down

Understand which fields and which areas of the field are drying down to help plan your harvest logistics.

Underperforming Area

low crop health

Not all areas of your fields perform the same and low NDVI doesn’t necessarily mean there is anything you can do to fix it this year. Underperforming Area alerts you to the fields and areas of the fields that are performing below their historical potential. This will allow you to quickly find those fields and areas and make adjustments to get them back on target and protect yield.

Nutrient Deficiency

nutrient deficiency

As the crop grows, it can tell us more of what is wrong with it. This analytic finds the fields and areas of the fields where there is a nutrient deficiency so that issues can be addressed before grain fill.

Disease Stress

disease risk

In conjunction with the Thermal Stress, Disease Stress alert takes into account weather information to more precisely indicate the type of stress impacting the crop.

Thermal Stress

thermal risk

Using our thermal imagery, AGMRI can detect elevated heat patterns of the crop that indicate crop stress.

Crop Health

Crop Health

Get a complete view of your farms and fields and identify where yield potential is ranked highest to the lowest.

Weed Map & Weed Escape

weed escape

Know what fields and areas of the fields have weeds. With machine integration or based on planting date, be alerted to what fields have weeds that may be impacting yield.

Historical Field Performance

AGMRI creates 5 performance zones in each field based on the historical average of those zones. This data is used to compare the current season to help understand where you are underperforming from the zone potential.

Low Emergence

low emergence

Notification of what fields and areas of the field have poor emergence.

Stand Assessment

strand assessment

AGMRI detects the established rows and uses computer vision and machine learning to determine the best segment of row and compares the rest of the field to that segment to give you a relative map. If machine data is integrated, a stand population map is returned.