dots-horizontal

Pinpointing Problem Fields During Planting Season Using AGMRI

Background:

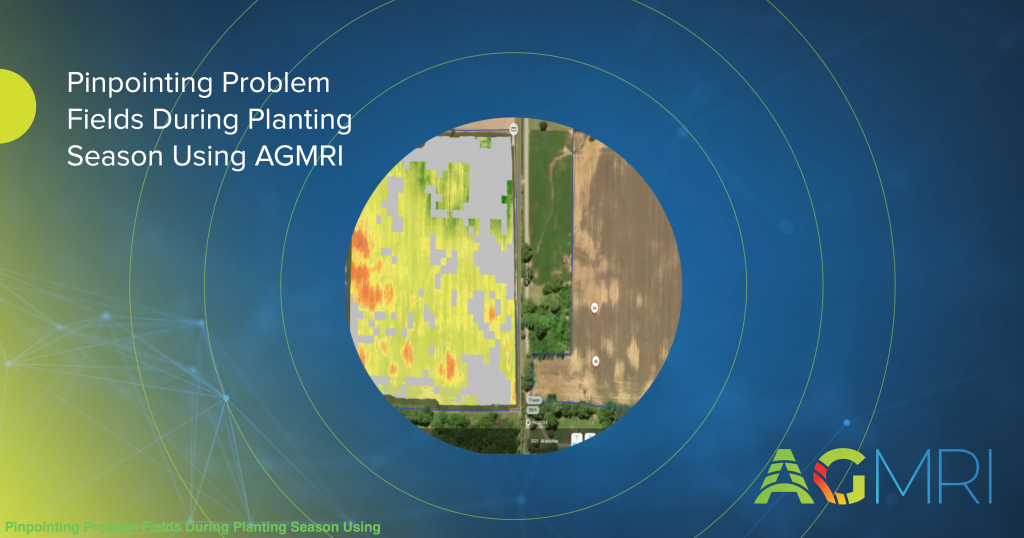
An Indiana grower was in the middle of planting with limited time to revisit recently planted fields. His acres are spread across a wide region experiencing highly variable weather—some fields were saturated, while others were bone dry. This made it incredibly difficult to monitor conditions and address emerging issues promptly. Historically, spotting emergence problems early has been a challenge, especially when weather conditions shift rapidly between locations. To stay ahead of problems without physically scouting every field, the grower turned to AGMRI, leveraging its ability to remotely monitor conditions and alert them to trouble spots.

Challenge:

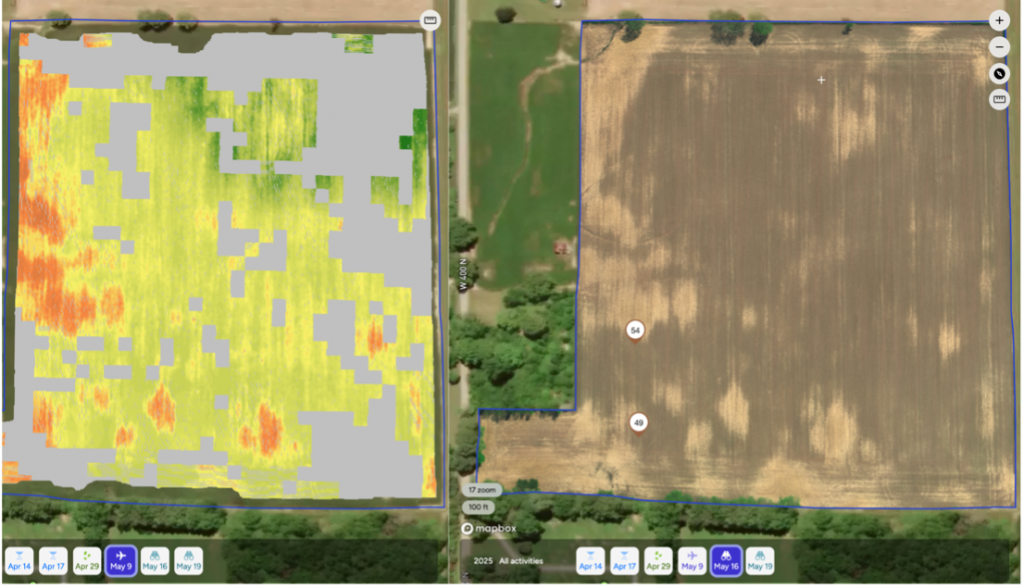
During a routine AGMRI review, emergence maps flagged a concern in one of the soybean fields. The grower was uncertain whether the poor emergence would resolve itself over time or if replanting would be necessary.

He opted to monitor the field for a couple of weeks, but the emergence percentage never improved. Ground scouting of low-emergence zones confirmed that many plants had pushed hard through crusted soil only to result in “broken necks”—a sure sign that those plants wouldn’t survive.

If nothing had been done, the stand loss would have likely led to noticeable yield drag, and we decided to take action. Without intervention, the farmer risked having 21% of the field suffer from inadequate emergence, which would drastically reduce his yield and impact his overall ROI for the year. The urgency of the situation and the tight schedule meant he needed a dependable data source to inform his replanting decisions quickly.

Variable emergence across the field due to dry soil conditions. Initial dryness followed by a pounding rain led to soil crusting, hindering seedling emergence. After observing no improvement in emergence several days post-rain, the grower determined replanting soybeans was necessary.

Solution:

Using AGMRI’s rainfall accumulation layer, the grower identified that this specific field had received just enough rain after planting to crust the already dry soil. Pairing this rainfall data with the emergence layer, AGMRI told a clear story: this wasn’t a one-off issue, it was a pattern across the field that needed to be addressed.

This insight allowed the grower to prioritize scouting in the most affected zones. Based on what they found, a decision was made to add soybean seed to supplement the low-population areas and protect the season’s yield potential.

Results:

With AGMRI providing targeted insights, the grower is now moving forward with replanting soybeans at an angle to the original rows in the low-emergence zones.

AGMRI not only helped identify issues remotely but also gave the grower confidence to act quickly. In the future, AGMRI will be a critical tool in helping the grower monitor variable conditions and make fast, informed decisions across his entire operation.

Share This Article

RELATED BLOG POSTS

[pdf-embedder url=”https://www.intelinair.com/wp-content/uploads/2024/10/Topography-Layer.pdf”

Yield Forecast

Understand where your corn yield is based on the current state of the crop. As the season unfolds, see how it is having an impact on your final yield.

Yield Loss

Powered by years of Nitrogen research at the University of Missouri, our corn Yield Loss analytic, powered by NVision Ag, gives insight into potential yield loss due to Nitrogen deficiency. Optional analytic for nitrogen management.

Variable Dry Down

variable dry down

Understand which fields and which areas of the field are drying down to help plan your harvest logistics.

Underperforming Area

low crop health

Not all areas of your fields perform the same and low NDVI doesn’t necessarily mean there is anything you can do to fix it this year. Underperforming Area alerts you to the fields and areas of the fields that are performing below their historical potential. This will allow you to quickly find those fields and areas and make adjustments to get them back on target and protect yield.

Nutrient Deficiency

nutrient deficiency

As the crop grows, it can tell us more of what is wrong with it. This analytic finds the fields and areas of the fields where there is a nutrient deficiency so that issues can be addressed before grain fill.

Disease Stress

disease risk

In conjunction with the Thermal Stress, Disease Stress alert takes into account weather information to more precisely indicate the type of stress impacting the crop.

Thermal Stress

thermal risk

Using our thermal imagery, AGMRI can detect elevated heat patterns of the crop that indicate crop stress.

Crop Health

Crop Health

Get a complete view of your farms and fields and identify where yield potential is ranked highest to the lowest.

Weed Map & Weed Escape

weed escape

Know what fields and areas of the fields have weeds. With machine integration or based on planting date, be alerted to what fields have weeds that may be impacting yield.

Historical Field Performance

AGMRI creates 5 performance zones in each field based on the historical average of those zones. This data is used to compare the current season to help understand where you are underperforming from the zone potential.

Low Emergence

low emergence

Notification of what fields and areas of the field have poor emergence.

Stand Assessment

strand assessment

AGMRI detects the established rows and uses computer vision and machine learning to determine the best segment of row and compares the rest of the field to that segment to give you a relative map. If machine data is integrated, a stand population map is returned.

YOUR MESSAGE WAS SENT SUCCESSFULLY!

dots-horizontal

We have received your inquiry and we’ll be in touch with you soon

Thank you for contacting us.