
Measurement is an important aspect of our day-to-day activities and a critical part of production agriculture to measure field health and performance.
Consider that in corn and soybean production, we end the season taking measurements of what the crop produced, testing and measuring what nutrients the soil requires to be productive for the next season, and using a number of other postseason measurements to plan for the next season.
We then start each production season measuring soil moisture and temperature, then measuring any number of factors including emergence and stand counting, crop growth against GDDs precipitation, testing and applying crop nutrients, scouting and reviewing pest infestations against established thresholds, reviewing the success of varied in-season applications, assessing crop maturity, and finally concluding by measuring yields for the year to start the cycle over again.
Early Detection, Early Opportunities
Given the conditions in 2023, continued measurement of potential disease infestations is a key need given the variability in the growth stage of the crop, as well as the variability in precipitation, humidity levels and temperature levels seen in recent weeks. With corn progressing through reproductive growth stages – the latest USDA report indicated that 68% of this year’s corn crop is in the silking or R1 growth stage. No doubt some fields could be at a further growth stage, R2 or blister – so the time to remain vigilant in scouting for corn diseases is now.
Consider Tar Spot, with its potential impact on yield potential. The following map from Purdue University gives an indication of Tar Spot status in key areas of the Midwest last week.
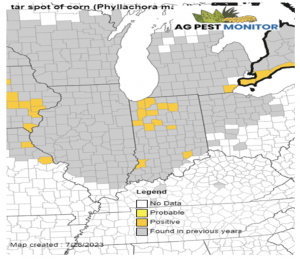
Tar Spot Infestation Map, July 26, 2023. https://extension.entm.purdue.edu/newsletters/pestandcrop/article/indiana-disease-update-in-corn-2/
While the drought conditions in many areas have impacted moisture availability this season, there is still an ongoing concern with Tar Spot infestation considering a number of factors researchers have concluded impact the development of Tar Spot in corn:
- Cool conditions (60-70 degrees F)
- Humid conditions (>75% relative humidity)
- Prolonged leaf wetness (>7 hours)
While we are having hotter temperatures, forecasts for this week show a cooling trend, with lower nighttime temperatures. Continued scouting is key as prior research has shown that a well-timed fungicide application from the tassel to milk stages (VT to R3) can help reduce disease and protect yield potential. This is important given the large amounts of acres in the Midwest which have had Tar Spot in prior seasons as shown in the gray shaded areas of the Tar Spot Infestation map.
Continued use of AGMRI with its features of thermal alerts combined with weather data is a critical tool in the need for ongoing crop scouting and monitoring.
Considering other measurements to use for applications for this season is the Stress Degree Day index, or SDD.
This index was developed by Dr. Elwynn Taylor at Iowa State University using multi-year data which summarized the effect of cumulative temperatures in excess of 86 degrees on final corn yields. The SDD calculates the daily high degrees above 86 degrees and then tracks a cumulative number for a field in season. Once the SDD number is summed and is above 140, Dr. Taylor’s research demonstrated that corn yields decreased. The degree of yield decrease was shown to be dependent on moisture sufficiency or deficiency within an individual field. As well other factors like pollen viability, hybrid grown, soil textures, and other management inputs also need to be factored in.
AGMRI with our continuing developmental capabilities with data analysis is an invaluable tool for our customers and their trusted advisors to use in season to monitor and measure field health and performance.


