We’re thrilled to share that SeedTrax, the pioneering digital platform developed through a collaboration between Hubner Industries and Intelinair, has secured the No. 2 spot in Seed World’s Global Innovation Showdown.
Bridging the Digital Gap in Seed Corn Production
While most digital ag technologies have historically targeted commercial crops—spanning over 90 million acres of corn and 85 million acres of soybeans—seed corn has remained underserved. But seed corn isn’t just another crop. It’s a high-value, high-complexity operation that demands its own tools, insights, and infrastructure.
That’s where SeedTrax comes in. Born out of the Wabash Heartland Innovation Network (WHIN), this platform was custom-built to support the unique challenges of seed corn production—from preseason planning and hybrid mapping to yield heatmaps and pollen tracking.
As Doug Hubner, CEO of Hubner Industries, puts it: “We didn’t have any digital tools specifically for seed corn. This gives me a digital eye on all the fields… I’m asking good questions, rather than not knowing anything.”
Built for Seed Corn—Not Bent to Fit
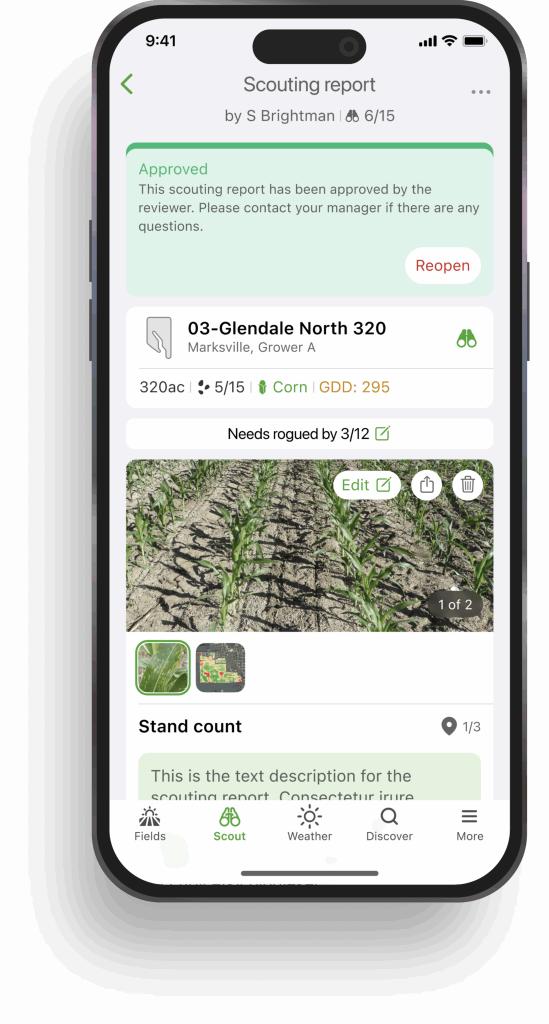
SeedTrax enables producers to manage seed fields at an unprecedented level of precision. In a 100-acre field with multiple hybrids and parents, agronomic management isn’t optional—it’s essential. SeedTrax provides:
- Hybrid-specific field mapping
- Tassel and silk tracking
- Stand counts and weed hotspots
- In-season imagery for remote oversight
- Real-time scouting data
For decision-makers, this means scaling agronomic oversight without scaling headcount—especially critical as seed production complexity increases.
Real-Time Intelligence, Real-World Results
Already deployed across more than 10,000 acres and growing to 30,000 acres in 2025, SeedTrax is enabling field scouts to manage more hybrids across more acres with better support. It’s also generating reliable data that helps:
- Optimize scouting coverage
- Improve yield estimations
- Strengthen supply forecasting
The platform isn’t just about short-term gains—it’s positioning growers for sustainable, scalable growth in a market with fewer experienced seedsmen and higher demand.
Innovation Grounded in Legacy
Doug Hubner’s passion for seed production is deeply rooted—his family has worked in seed corn since the 1930s. That legacy drives his push to modernize production tools, including R&D on camera-enabled sprayers to one day monitor pollen shed through SeedTrax. “It’s not for me; it’s not for SeedTrax. It’s what I’ve always dreamed of doing.”
A Future for the Entire Industry
With pilot partners already on board, the SeedTrax team is now focused on broader rollout strategies to deliver these benefits industry-wide. It’s not just about internal efficiencies—it’s about raising the bar across the seed corn value chain.
As Demitrius Kikalos, Intelinair’s territory account manager, explains,“With food security and sustainability being a top priority today, integrating technology into the seed production industry is crucial.”
The Journey Is Just Beginning
Recognition in the Seed World Global Innovation Showdown is a powerful milestone—but for Intelinair and Hubner Industries, it’s just the beginning of the SeedTrax journey. With the backing of legacy, innovation, and a shared vision for the future of seed corn, SeedTrax is poised to redefine how the industry thinks about digital agronomy.
We’re proud of this achievement—and even more excited for what’s ahead.