dots-horizontal

Stand Assessment: Evaluating Emergence with AGMRI

AGMRI Use Case

AGMRI evaluates stand assessment by using imagery to create an estimated population map around V4 for fixed wing imagery. Past and current imagery layers can be used to see why areas may have lower emergence scores due to topography, soil temperatures, or equipment malfunctions.

How it Works: AGMRI uses Row Tracer technology to detect established rows, evaluates established plants using Infrared layer and NDVI, and then looks for missing plants. When a planted population is given, AGMRI will provide an estimated plant stand or in the situation where no planted population is available, the platform will report as a percent of established stand.

The vegetation layer is also very helpful when looking at plant stands as it removes soil interference from the map and only reports back the plant biomass within the row.

Situation: Using AGMRI, a farmer reviewed a vegetation map that showed streaking. The thermal map was reviewed next, and the map showed that the poorer plant vigor aligned with a cooler area in the field. See the map below for reference.

Thermal Map – April 30
Vegetation Map – May 22

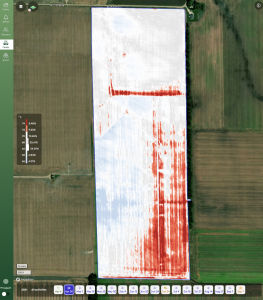
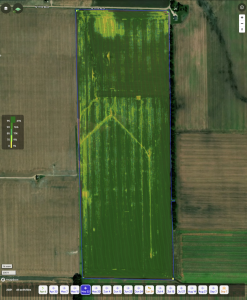
How AGMRI Helps: It was identified that the farmer split planted two corn hybrids on April 1. AGMRI’s thermal and vegetation maps showed that Seed A emerged better in cooler soils. In this situation, the farmer was able to use the data to make more informed decisions about the most optimal soil conditions for different hybrids for early season planting and used the information to protect yield potential.

Scouting Tip: Use AGMRI vegetation layer or Infrared maps to identify areas of potential low or slower plant growth, then go to these areas to take a closer look using your preferred stand count method.  Consult academic resources like Purdue’s guide to corn replant decisions or soybean replant decisions for stand establishment requirements.

Contact us for more information or to schedule an AGMRI demo.

Share This Article

RELATED BLOG POSTS

Yield Forecast

Understand where your corn yield is based on the current state of the crop. As the season unfolds, see how it is having an impact on your final yield.

Yield Loss

Powered by years of Nitrogen research at the University of Missouri, our corn Yield Loss analytic, powered by NVision Ag, gives insight into potential yield loss due to Nitrogen deficiency. Optional analytic for nitrogen management.

Variable Dry Down

variable dry down

Understand which fields and which areas of the field are drying down to help plan your harvest logistics.

Underperforming Area

low crop health

Not all areas of your fields perform the same and low NDVI doesn’t necessarily mean there is anything you can do to fix it this year. Underperforming Area alerts you to the fields and areas of the fields that are performing below their historical potential. This will allow you to quickly find those fields and areas and make adjustments to get them back on target and protect yield.

Nutrient Deficiency

nutrient deficiency

As the crop grows, it can tell us more of what is wrong with it. This analytic finds the fields and areas of the fields where there is a nutrient deficiency so that issues can be addressed before grain fill.

Disease Stress

disease risk

In conjunction with the Thermal Stress, Disease Stress alert takes into account weather information to more precisely indicate the type of stress impacting the crop.

Thermal Stress

thermal risk

Using our thermal imagery, AGMRI can detect elevated heat patterns of the crop that indicate crop stress.

Crop Health

Crop Health

Get a complete view of your farms and fields and identify where yield potential is ranked highest to the lowest.

Weed Map & Weed Escape

weed escape

Know what fields and areas of the fields have weeds. With machine integration or based on planting date, be alerted to what fields have weeds that may be impacting yield.

Historical Field Performance

AGMRI creates 5 performance zones in each field based on the historical average of those zones. This data is used to compare the current season to help understand where you are underperforming from the zone potential.

Low Emergence

low emergence

Notification of what fields and areas of the field have poor emergence.

Stand Assessment

strand assessment

AGMRI detects the established rows and uses computer vision and machine learning to determine the best segment of row and compares the rest of the field to that segment to give you a relative map. If machine data is integrated, a stand population map is returned.