dots-horizontal

Unexpected Yields in 2022? Check out AGMRI to review growing conditions

With 2022 in the rearview mirror and 2023 planning in full gear, you may be asking “why” a field performed a certain way last year. Did you know that AGMRI can help you recall challenging fields, those that didn’t quite measure up to expectations or those that exceeded expectations?

Follow these four steps to use AGMRI to review your fields:


1. Log in to AGMRI and review the fields and find the ones you’d like to dig deeper into.

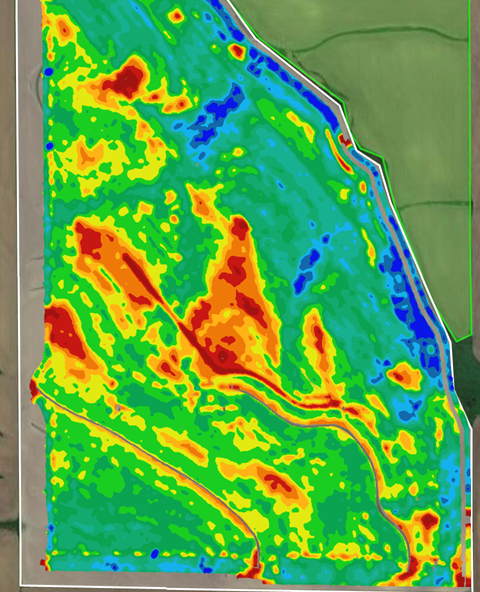
In the example below, the farmer had areas of his field that yielded lower than expected, as indicated in the areas of darker red.


2. Once a field of interest has been identified, scan the seasonal timeline to see if any images stand out.

Both the NDVI and Aerial are good layers to begin assessing any areas of the field that correlate with either lower or higher than expected crop production. In this field below, the farmer experienced consistent Low Crop Health alerts in several areas and on multiple layers.


unnamed-2.png


unnamed-3.png


3. You might have ideas of what could have happened within the fields of interest. To explore further, here is a quick guide to learn more and do comparisons using the different features on AGMRI.

  1. Soil Type & Topography map layers can be helpful in understanding potential interactions impacting performance (photo below).

  2. Seed Product Performance can be reviewed to understand how those genetics perform in a variety of field conditions.

  3. Nutrient Deficiencies appear as a yellow crop on Aerial or red areas on NDVI.

  4. Crop Stress/Disease also can be a factor in performance and assessed via the thermal layer.

  5. Emergence Maps can be viewed earlier in the season to see if any areas of the field were slower to emerge or had lower populations.


4. Share your insights and questions with your network of agronomy and seed advisors.

In this example, the farmer ruled out soil type and topography differences but could see a possible nutrient deficiency from the aerial photo. Talking with his fertilizer advisor led to reviewing application maps and discovering areas where P & K application had been missed three years prior.

If you have any questions about using AGMRI to help assess yield trends in your field, reach out to your Account Manager.

Share This Article

RELATED BLOG POSTS

Yield Forecast

Understand where your corn yield is based on the current state of the crop. As the season unfolds, see how it is having an impact on your final yield.

Yield Loss

Powered by years of Nitrogen research at the University of Missouri, our corn Yield Loss analytic, powered by NVision Ag, gives insight into potential yield loss due to Nitrogen deficiency. Optional analytic for nitrogen management.

Variable Dry Down

variable dry down

Understand which fields and which areas of the field are drying down to help plan your harvest logistics.

Underperforming Area

low crop health

Not all areas of your fields perform the same and low NDVI doesn’t necessarily mean there is anything you can do to fix it this year. Underperforming Area alerts you to the fields and areas of the fields that are performing below their historical potential. This will allow you to quickly find those fields and areas and make adjustments to get them back on target and protect yield.

Nutrient Deficiency

nutrient deficiency

As the crop grows, it can tell us more of what is wrong with it. This analytic finds the fields and areas of the fields where there is a nutrient deficiency so that issues can be addressed before grain fill.

Disease Stress

disease risk

In conjunction with the Thermal Stress, Disease Stress alert takes into account weather information to more precisely indicate the type of stress impacting the crop.

Thermal Stress

thermal risk

Using our thermal imagery, AGMRI can detect elevated heat patterns of the crop that indicate crop stress.

Crop Health

Crop Health

Get a complete view of your farms and fields and identify where yield potential is ranked highest to the lowest.

Weed Map & Weed Escape

weed escape

Know what fields and areas of the fields have weeds. With machine integration or based on planting date, be alerted to what fields have weeds that may be impacting yield.

Historical Field Performance

AGMRI creates 5 performance zones in each field based on the historical average of those zones. This data is used to compare the current season to help understand where you are underperforming from the zone potential.

Low Emergence

low emergence

Notification of what fields and areas of the field have poor emergence.

Stand Assessment

strand assessment

AGMRI detects the established rows and uses computer vision and machine learning to determine the best segment of row and compares the rest of the field to that segment to give you a relative map. If machine data is integrated, a stand population map is returned.