dots-horizontal

Use Case: AGMRI Helps Grower Make Confident Fungicide Decisions

Background

A farm manager leveraged technology to maximize efficiency on his operation. Earlier in the season, he used NVision for variable-rate urea applications to optimize nutrient management.

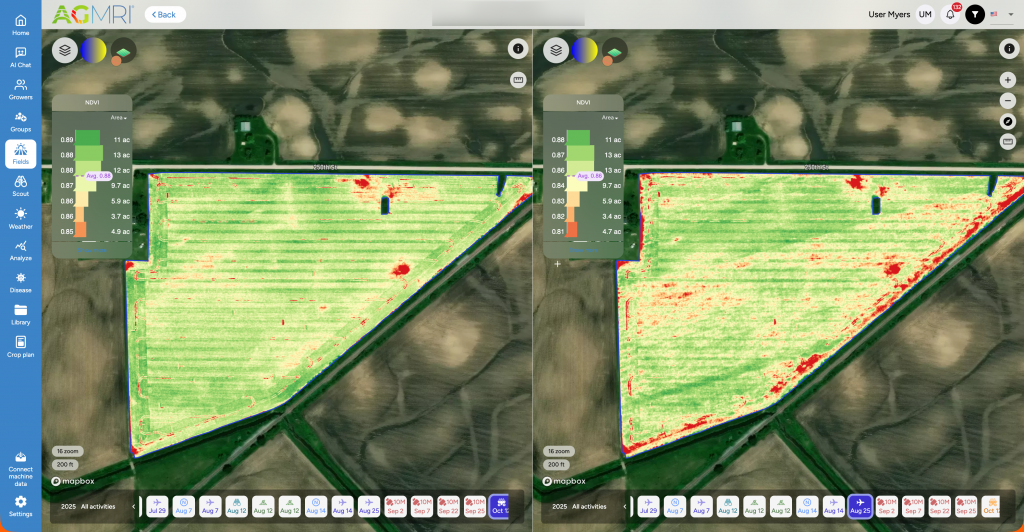
As the season progressed into later growth stages, he began weighing the economics of fungicide applications. With commodity prices fluctuating, the key question was whether making two passes of fungicide would pay off. By analyzing AGMRI’s nutrient deficiency and disease pressure layers in combination with crop stage data, the grower was able to narrow down the decision to a single field out of his six. That field showed a confident probability of delivering a positive ROI with a second fungicide pass.

Challenge

The grower was uncertain whether a second fungicide application would generate a return given current market conditions. Making multiple passes across all fields would be costly and time-intensive, with no guarantee of payoff. Without clear data, the risk of overspending on inputs or missing a yield-limiting disease outbreak weighed heavily on his decision.

AGMRI offered a way to evaluate both disease pressure and nutrient health across fields, providing an evidence-based approach to prioritize only those fields most likely to benefit.

Solution

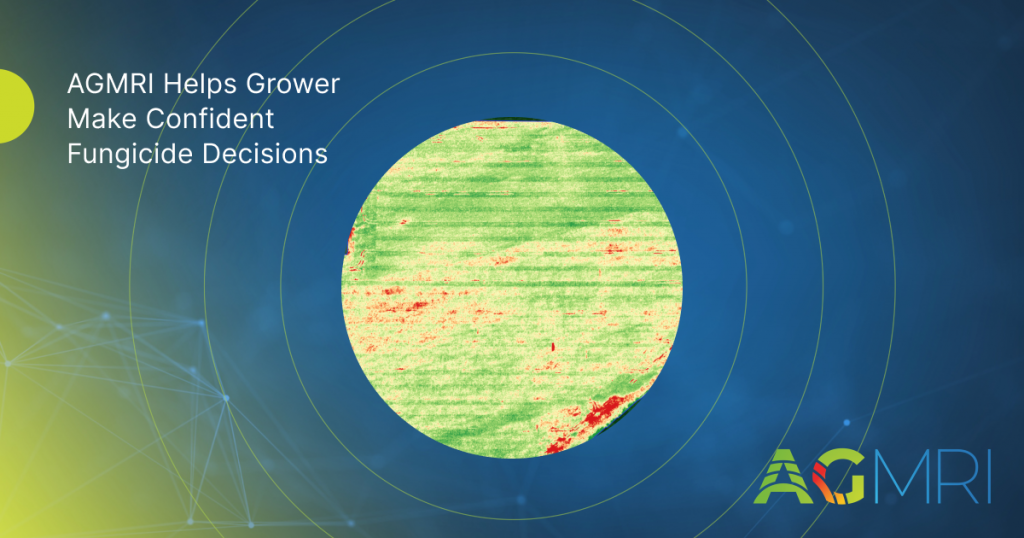
AGMRI’s database and mapping capabilities gave the grower the insights needed to answer his critical question. By reviewing nutrient deficiency imagery alongside disease pressure maps, he identified that only one field was likely to deliver a positive ROI with a second fungicide application.

Rather than taking a blanket approach across all six fields, AGMRI helped him focus on where the payoff was most probable. This data-driven decision provided both confidence and efficiency in planning late-season management.

Results

Though harvest data is still pending, early indications suggest the decision will pay off. The grower expects a yield increase of 6–12 bu/ac on the field receiving a second fungicide application. Beyond potential yield gains, this experience has reinforced his trust in using AGMRI to make smarter, field-specific decisions that reduce risk and maximize ROI.

Share This Article

RELATED BLOG POSTS

[pdf-embedder url=”https://www.intelinair.com/wp-content/uploads/2024/10/Topography-Layer.pdf”

Yield Forecast

Understand where your corn yield is based on the current state of the crop. As the season unfolds, see how it is having an impact on your final yield.

Yield Loss

Powered by years of Nitrogen research at the University of Missouri, our corn Yield Loss analytic, powered by NVision Ag, gives insight into potential yield loss due to Nitrogen deficiency. Optional analytic for nitrogen management.

Variable Dry Down

variable dry down

Understand which fields and which areas of the field are drying down to help plan your harvest logistics.

Underperforming Area

low crop health

Not all areas of your fields perform the same and low NDVI doesn’t necessarily mean there is anything you can do to fix it this year. Underperforming Area alerts you to the fields and areas of the fields that are performing below their historical potential. This will allow you to quickly find those fields and areas and make adjustments to get them back on target and protect yield.

Nutrient Deficiency

nutrient deficiency

As the crop grows, it can tell us more of what is wrong with it. This analytic finds the fields and areas of the fields where there is a nutrient deficiency so that issues can be addressed before grain fill.

Disease Stress

disease risk

In conjunction with the Thermal Stress, Disease Stress alert takes into account weather information to more precisely indicate the type of stress impacting the crop.

Thermal Stress

thermal risk

Using our thermal imagery, AGMRI can detect elevated heat patterns of the crop that indicate crop stress.

Crop Health

Crop Health

Get a complete view of your farms and fields and identify where yield potential is ranked highest to the lowest.

Weed Map & Weed Escape

weed escape

Know what fields and areas of the fields have weeds. With machine integration or based on planting date, be alerted to what fields have weeds that may be impacting yield.

Historical Field Performance

AGMRI creates 5 performance zones in each field based on the historical average of those zones. This data is used to compare the current season to help understand where you are underperforming from the zone potential.

Low Emergence

low emergence

Notification of what fields and areas of the field have poor emergence.

Stand Assessment

strand assessment

AGMRI detects the established rows and uses computer vision and machine learning to determine the best segment of row and compares the rest of the field to that segment to give you a relative map. If machine data is integrated, a stand population map is returned.

YOUR MESSAGE WAS SENT SUCCESSFULLY!

dots-horizontal

We have received your inquiry and we’ll be in touch with you soon

Thank you for contacting us.