dots-horizontal

Use Case: AGMRI Helps Indiana Grower Prioritize Fungicide Applications, Preventing Significant Yield Loss from Tar Spot

Background

An Indiana corn and soybean farmer was challenged with timely and consistent field scouting. The 2025 growing season presented additional complexity, as variable planting dates and inconsistent precipitation led to uneven crop growth stages across the farm. The grower had experienced past issues with diseases like Tar Spot and knew the potential for significant yield loss if not managed promptly. However, manually scouting every field to determine disease presence and optimal fungicide timing was unrealistic given the number of acres he farms and the workload.

AGMRI detected elevated heat patterns on this field.

Challenge

His primary challenge was determining which fields required fungicide application and when to apply it. Because of the variability in planting dates and crop stages, making a blanket decision across the farm was risky. The grower minimized wasted time and money spraying low-risk fields while still protecting high-risk fields from yield-robbing diseases.


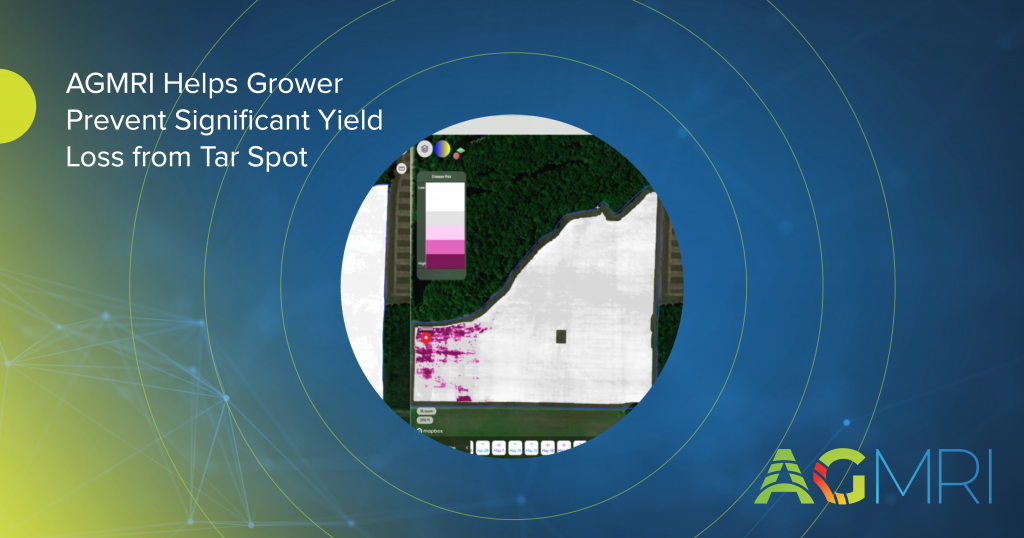
If the grower had missed identification and treatment of high-risk fields at the correct growth stage, Tar Spot alone could reduce yield by a range of 10–30 bushels per acre. Due to time constraints, inconsistent field scouting posed a real risk of missing the optimal fungicide application window.

Solution

The grower turned to AGMRI for precise, field-specific insights.

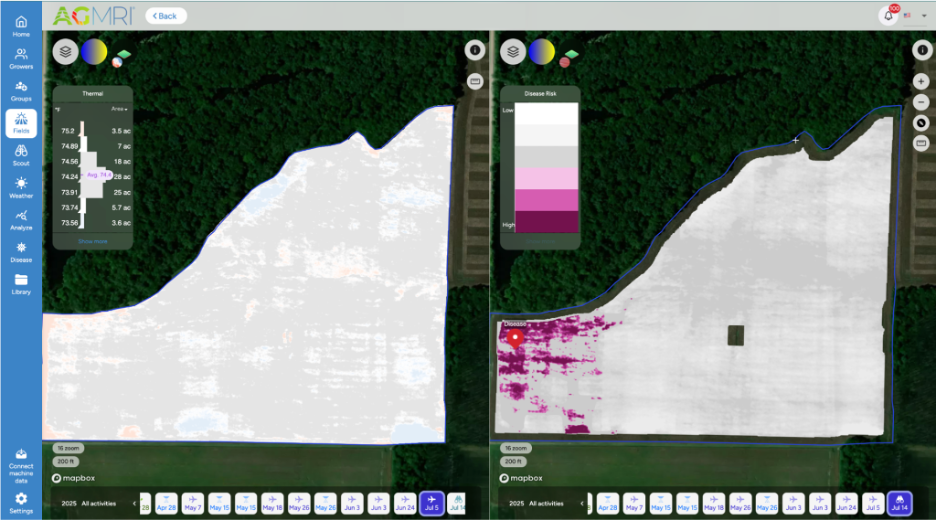
  • Disease Risk Alert: AGMRI’s alerts identified the fields at the highest risk for disease development, eliminating the need to manually scout every field.
  • Growth Stage: AGMRI helped pinpoint which fields were at the correct growth stage for fungicide application, ensuring no wasted passes on fields not yet ready.
  • Targeted Action: Once AGMRI flagged a field, the grower (or a scout) validated the presence of Tar Spot in the field, confirming the need for immediate action.

With these insights, the grower prioritized only the fields that required urgent treatment, saving both time and resources.

Results

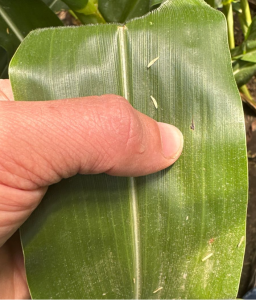
Upon confirmation of Tar Spot, the grower sprayed the field the same day, preventing potential yield loss. Given Tar Spot’s history of causing 10–30 bushels per acre yield reduction, this targeted, timely intervention likely preserved significant revenue.

The grower commented that AGMRI has become an integral part of his daily routine, providing efficiency and confidence in decision-making. By using AGMRI to monitor disease risk across all acres, he can now focus on high-priority fields and plans to continue relying on the program to proactively manage disease threats in future seasons.

Share This Article

RELATED BLOG POSTS

[pdf-embedder url=”https://www.intelinair.com/wp-content/uploads/2024/10/Topography-Layer.pdf”

Yield Forecast

Understand where your corn yield is based on the current state of the crop. As the season unfolds, see how it is having an impact on your final yield.

Yield Loss

Powered by years of Nitrogen research at the University of Missouri, our corn Yield Loss analytic, powered by NVision Ag, gives insight into potential yield loss due to Nitrogen deficiency. Optional analytic for nitrogen management.

Variable Dry Down

variable dry down

Understand which fields and which areas of the field are drying down to help plan your harvest logistics.

Underperforming Area

low crop health

Not all areas of your fields perform the same and low NDVI doesn’t necessarily mean there is anything you can do to fix it this year. Underperforming Area alerts you to the fields and areas of the fields that are performing below their historical potential. This will allow you to quickly find those fields and areas and make adjustments to get them back on target and protect yield.

Nutrient Deficiency

nutrient deficiency

As the crop grows, it can tell us more of what is wrong with it. This analytic finds the fields and areas of the fields where there is a nutrient deficiency so that issues can be addressed before grain fill.

Disease Stress

disease risk

In conjunction with the Thermal Stress, Disease Stress alert takes into account weather information to more precisely indicate the type of stress impacting the crop.

Thermal Stress

thermal risk

Using our thermal imagery, AGMRI can detect elevated heat patterns of the crop that indicate crop stress.

Crop Health

Crop Health

Get a complete view of your farms and fields and identify where yield potential is ranked highest to the lowest.

Weed Map & Weed Escape

weed escape

Know what fields and areas of the fields have weeds. With machine integration or based on planting date, be alerted to what fields have weeds that may be impacting yield.

Historical Field Performance

AGMRI creates 5 performance zones in each field based on the historical average of those zones. This data is used to compare the current season to help understand where you are underperforming from the zone potential.

Low Emergence

low emergence

Notification of what fields and areas of the field have poor emergence.

Stand Assessment

strand assessment

AGMRI detects the established rows and uses computer vision and machine learning to determine the best segment of row and compares the rest of the field to that segment to give you a relative map. If machine data is integrated, a stand population map is returned.

YOUR MESSAGE WAS SENT SUCCESSFULLY!

dots-horizontal

We have received your inquiry and we’ll be in touch with you soon

Thank you for contacting us.