Use Case: AGMRI Reveals Compaction Impact from New Tillage Practice
Background
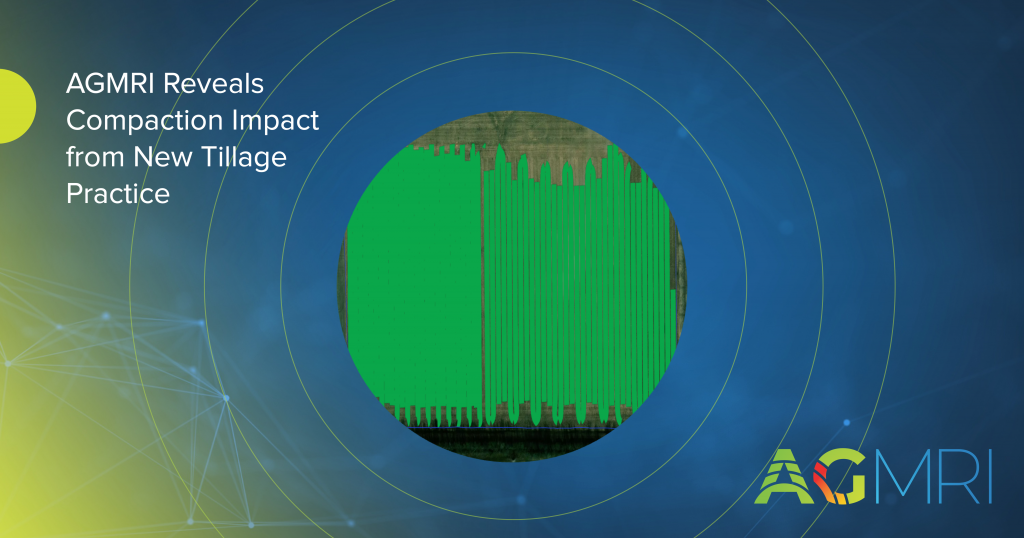
During a spring field review, a grower from Illinois and his local agronomy team evaluated several fields using AGMRI. While reviewing one particular field, the NDVI maps revealed a noticeable difference between two sections. When discussing management history, they learned a new harrow was used on one half of the field to test for residue management and seedbed preparation.
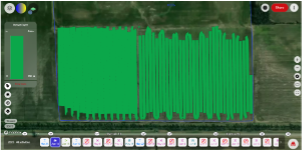
Tillage map. The right half of the field was done with the Kelly Diamond, and the left half was done with a cultivator.
Because of the visible variation noted in AGMRI, the team decided to monitor the field throughout the growing season to assess how the new equipment might be affecting crop performance. Early imagery suggested potential compaction issues in the area where the new equipment had been used. The field became a “test case” to track how soil conditions and tillage practices influenced plant health and yield performance over time.
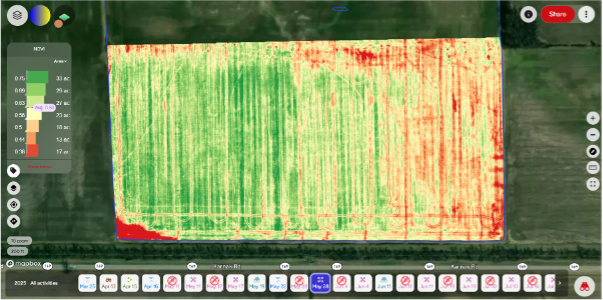
NDVI layer from May 28
Challenge
The grower was evaluating whether this new tillage equipment could be used more broadly across the operation. However, if the same performance issue occurred elsewhere, it could potentially lead to a 15–25 bu/ac yield reduction across multiple fields—a substantial impact on overall productivity and profitability.
Since this was the grower’s first season using AGMRI, it also presented an opportunity to demonstrate how the platform could identify and quantify management-related issues early. Without the AGMRI maps, the problem might not have been recognized until harvest, missing the chance to connect yield performance directly back to tillage practices.
Solution
During the spring visit, AGMRI’s NDVI map immediately revealed distinct differences in crop vigor between the two management zones. By comparing the early-season tillage map with mid-season imagery, the team confirmed the affected area aligned precisely with the area where the new tillage equipment was used.
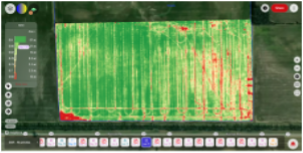
NDVI layer from June 11
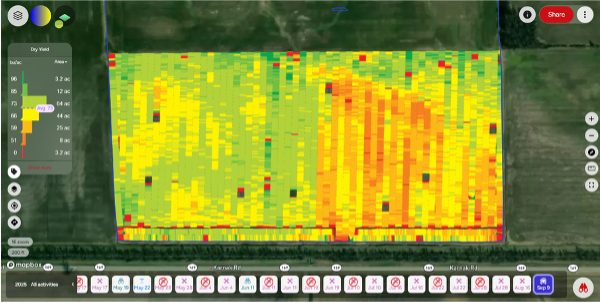
Through continuous monitoring, AGMRI provided a clear visual timeline of how the issue evolved through the growing season. When harvest data became available, it validated what the maps had indicated—the section worked using the new equipment showed consistent yield loss.
Results
Using AGMRI, the grower confirmed that compaction from the new tillage equipment resulted in yield loss. AGMRI allowed the issue to be detected, monitored, and quantified, turning what could have been a widespread problem into a contained learning opportunity.
With this additional insight, the grower plans to adjust how and where the equipment is used and evaluate soil conditions more closely before tillage. The experience demonstrated the value of analytics and imagery in assessing new management strategies and making confident, data-driven decisions.
By identifying a potential 15–25 bu/ac loss risk before more widely using his new equipment, the grower prevented larger-scale losses and reinforced the value of analytics and key learnings using AGMRI.
Understand where your corn yield is based on the current state of the crop. As the season unfolds, see how it is having an impact on your final yield.
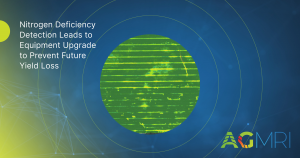
Yield Loss
Powered by years of Nitrogen research at the University of Missouri, our corn Yield Loss analytic, powered by NVision Ag, gives insight into potential yield loss due to Nitrogen deficiency. Optional analytic for nitrogen management.
Variable Dry Down
Understand which fields and which areas of the field are drying down to help plan your harvest logistics.
Underperforming Area
Not all areas of your fields perform the same and low NDVI doesn’t necessarily mean there is anything you can do to fix it this year. Underperforming Area alerts you to the fields and areas of the fields that are performing below their historical potential. This will allow you to quickly find those fields and areas and make adjustments to get them back on target and protect yield.
Nutrient Deficiency
As the crop grows, it can tell us more of what is wrong with it. This analytic finds the fields and areas of the fields where there is a nutrient deficiency so that issues can be addressed before grain fill.
Disease Stress
In conjunction with the Thermal Stress, Disease Stress alert takes into account weather information to more precisely indicate the type of stress impacting the crop.
Thermal Stress
Using our thermal imagery, AGMRI can detect elevated heat patterns of the crop that indicate crop stress.
Crop Health
Get a complete view of your farms and fields and identify where yield potential is ranked highest to the lowest.
Weed Map & Weed Escape
Know what fields and areas of the fields have weeds. With machine integration or based on planting date, be alerted to what fields have weeds that may be impacting yield.
Historical Field Performance
AGMRI creates 5 performance zones in each field based on the historical average of those zones. This data is used to compare the current season to help understand where you are underperforming from the zone potential.
Low Emergence
Notification of what fields and areas of the field have poor emergence.
Stand Assessment
AGMRI detects the established rows and uses computer vision and machine learning to determine the best segment of row and compares the rest of the field to that segment to give you a relative map. If machine data is integrated, a stand population map is returned.
YOUR MESSAGE WAS SENT SUCCESSFULLY!
We have received your inquiry and we’ll be in touch with you soon.