dots-horizontal

Use Case: Identifying Tillage Tool Impact on Emergence and Yield with AGMRI

Background

A multi-generational farming operation, managed by two brothers in Indiana, grows corn and soybeans, and follows a proven management approach built on years of experience. They recognize the importance of staying competitive and take a thoughtful, selective approach to adopting new practices when the benefits are clear.

In this situation, one brother was responsible for operating the vertical tillage (VT) tool early in the spring. Due to heavy weed pressure, he adjusted the disk angle to a more aggressive setting to chop residue more effectively. However, he did not reset the tool when moving on to other fields, assuming the same setup would work across the operation. This oversight led to unintended soil effects that became visible later in the season.

Challenge

During a planning session, we discussed how AGMRI imagery and full-farm data could highlight operational inefficiencies and support more informed management decisions. We selected a few fields and focused on equipment management, since the farm had been using the same machinery and practices for years without modification.

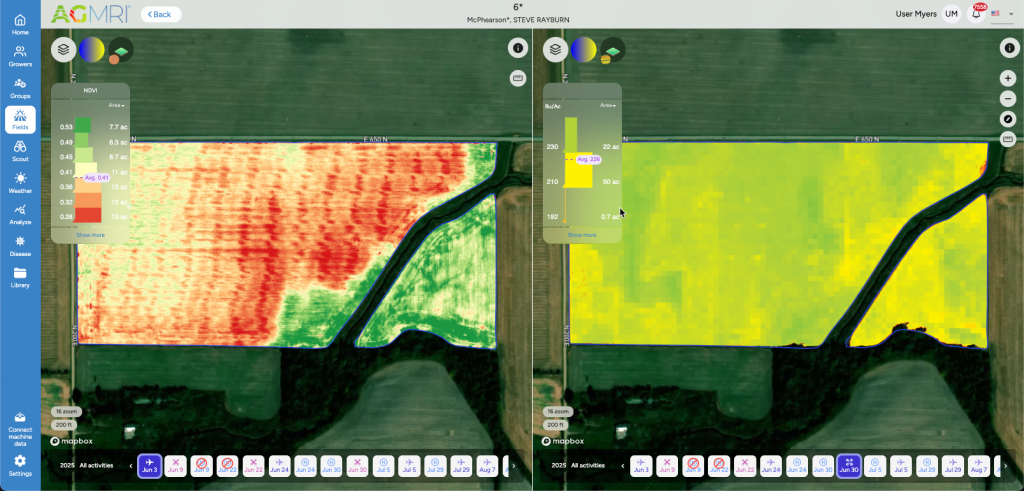
Shortly after planting, AGMRI imagery revealed a distinct cross-hatch pattern across multiple fields. This suggested overlapping tillage passes at different angles. After reviewing their tillage practices, we confirmed that all corn acres had been worked with the same VT tool. By analyzing the imagery, we identified the angle of tillage, measured the swath width, and concluded that the pattern originated from the aggressively set VT tool.

Showing the aerial pattern June 3rd and yield forecast June 24. Yield forecast is following the bare areas as a result of poor stand and uneven emergence.

The aggressive angle caused what we call a checkered pattern, resulting from a “smearing effect”—the disk collected soil and residue until it built up, then released it, dragging the soil rather than tilling properly. This created compacted zones, which appeared as dark red areas on NDVI imagery during emergence, indicating potential poor crop vigor or smaller plants.

NDVI shows the tillage (smearing) pattern which impacts yield forecast June 30. The impact of the disks being set too aggressively can be 10-20 bushels due to poor root development / lack of nutrient availability.

 Solution

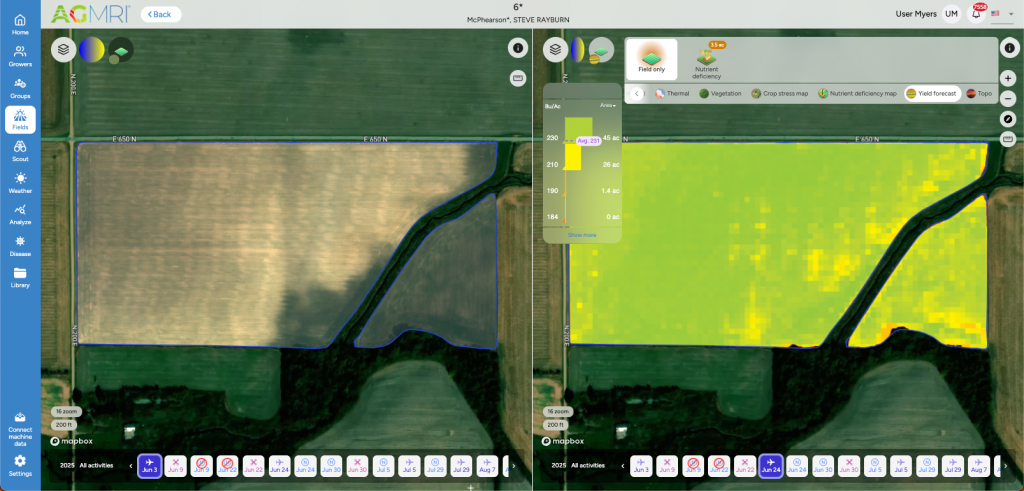
Using AGMRI emergence imagery (early June) and yield forecast layers (late June), we correlated the checkered pattern to uneven emergence and potential yield drag in the affected areas.

By overlaying crop stress layers with yield forecasts, we estimated an average impact of approximately 10 bushels per acre in the affected zones. The clear visual correlation between tillage patterns, emergence, and yield potential helped the growers understand the root cause and consider adjustments to their management practices going forward.

Results

The growers were surprised at how clearly the imagery exposed the impact of their tillage settings. They recognized the need to adjust their practices and planned to run the VT tool in a less aggressive setting during future tillage passes.

Because the issue was identified ahead of the next fall and spring tillage seasons, they can make changes proactively. This insight is expected to improve emergence and plant health, ultimately supporting higher yield potential and better ROI in future growing seasons.

Share This Article

RELATED BLOG POSTS

[pdf-embedder url=”https://www.intelinair.com/wp-content/uploads/2024/10/Topography-Layer.pdf”

Yield Forecast

Understand where your corn yield is based on the current state of the crop. As the season unfolds, see how it is having an impact on your final yield.

Yield Loss

Powered by years of Nitrogen research at the University of Missouri, our corn Yield Loss analytic, powered by NVision Ag, gives insight into potential yield loss due to Nitrogen deficiency. Optional analytic for nitrogen management.

Variable Dry Down

variable dry down

Understand which fields and which areas of the field are drying down to help plan your harvest logistics.

Underperforming Area

low crop health

Not all areas of your fields perform the same and low NDVI doesn’t necessarily mean there is anything you can do to fix it this year. Underperforming Area alerts you to the fields and areas of the fields that are performing below their historical potential. This will allow you to quickly find those fields and areas and make adjustments to get them back on target and protect yield.

Nutrient Deficiency

nutrient deficiency

As the crop grows, it can tell us more of what is wrong with it. This analytic finds the fields and areas of the fields where there is a nutrient deficiency so that issues can be addressed before grain fill.

Disease Stress

disease risk

In conjunction with the Thermal Stress, Disease Stress alert takes into account weather information to more precisely indicate the type of stress impacting the crop.

Thermal Stress

thermal risk

Using our thermal imagery, AGMRI can detect elevated heat patterns of the crop that indicate crop stress.

Crop Health

Crop Health

Get a complete view of your farms and fields and identify where yield potential is ranked highest to the lowest.

Weed Map & Weed Escape

weed escape

Know what fields and areas of the fields have weeds. With machine integration or based on planting date, be alerted to what fields have weeds that may be impacting yield.

Historical Field Performance

AGMRI creates 5 performance zones in each field based on the historical average of those zones. This data is used to compare the current season to help understand where you are underperforming from the zone potential.

Low Emergence

low emergence

Notification of what fields and areas of the field have poor emergence.

Stand Assessment

strand assessment

AGMRI detects the established rows and uses computer vision and machine learning to determine the best segment of row and compares the rest of the field to that segment to give you a relative map. If machine data is integrated, a stand population map is returned.

YOUR MESSAGE WAS SENT SUCCESSFULLY!

dots-horizontal

We have received your inquiry and we’ll be in touch with you soon

Thank you for contacting us.