dots-horizontal

Use Case: Targeted V5 Fungicide Application Leads to Increased ROI During Challenging Early Season

Background

An Indiana grower met with his crop advisor in late May to early June to review strategies for improving crop health and yield potential. Coming off a tough spring with multiple cold days between planting and emergence, disease pressure—particularly from tar spot—was a significant concern due to the previous year’s experience. Although the grower had never applied a fungicide at the V5 stage before, he had heard of others doing so.

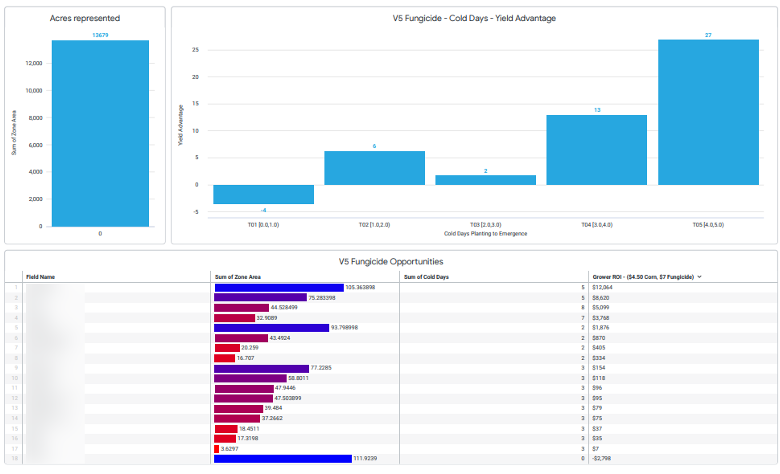
During the meeting, the crop advisor shared a V5 fungicide response chart built from over 13,000 acres of 2024 data. The chart highlighted the potential impact of V5 applications on fields with more than three cold days between planting and emergence, helping the grower visualize the opportunity to support his crop through early stress.

Chart showing fields. where a V5 fungicide application would be advantageous.

Challenge

The grower was interested in a V5 fungicide application but uncertain whether applying it across all his fields would provide a consistent return. His acres included both high-performing, irrigated fields and lower-yielding, more variable ground. Blanket application could be costly and inefficient.

He needed a way to identify which fields would benefit most from the treatment—especially during a busy part of the season when chemical and labor decisions must be prioritized carefully.

Side by side imagery of a spring application of fungicide on a part of a field and the NDVI map of the field later in the season showing the result.

Solution

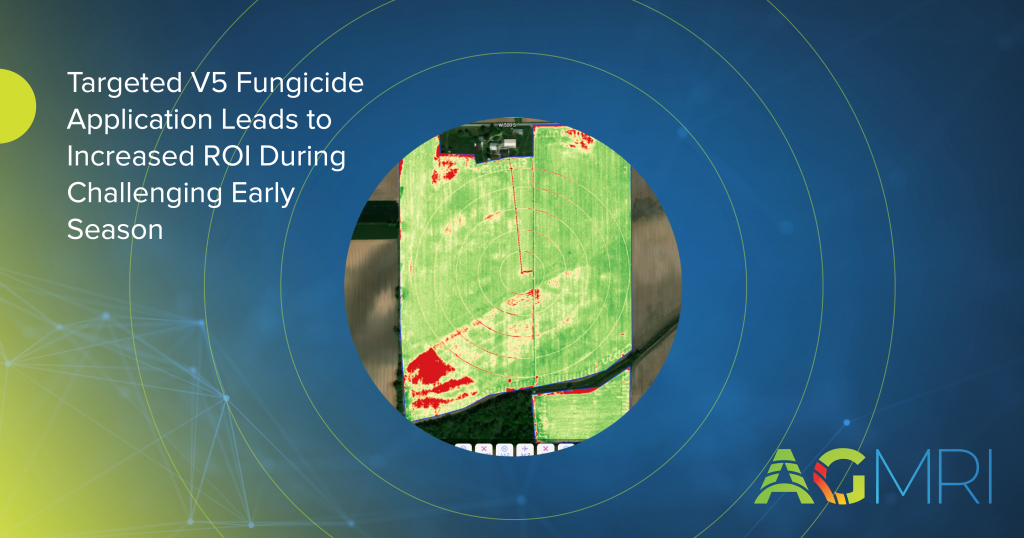
Using AGMRI data, the crop advisor provided a chart that pinpointed fields most likely to benefit from a V5 fungicide application (shown above). This data-driven approach allowed the grower to target specific fields rather than applying fungicide uniformly across his acres.

By focusing on fields with early cold stress and higher disease risk, he could confidently move forward with applications that would generate a return on investment.

Results

The data showed that treated areas in the targeted fields experienced an average 3.5 bushel per acre increase compared to untreated areas. By using a cost-effective fungicide, the grower more than covered his application costs and saw a clear financial benefit.

Encouraged by the outcome, the grower plans to use AGMRI in future seasons to refine and prioritize field treatments, particularly during critical growth stages.

Share This Article

RELATED BLOG POSTS

[pdf-embedder url=”https://www.intelinair.com/wp-content/uploads/2024/10/Topography-Layer.pdf”

Yield Forecast

Understand where your corn yield is based on the current state of the crop. As the season unfolds, see how it is having an impact on your final yield.

Yield Loss

Powered by years of Nitrogen research at the University of Missouri, our corn Yield Loss analytic, powered by NVision Ag, gives insight into potential yield loss due to Nitrogen deficiency. Optional analytic for nitrogen management.

Variable Dry Down

variable dry down

Understand which fields and which areas of the field are drying down to help plan your harvest logistics.

Underperforming Area

low crop health

Not all areas of your fields perform the same and low NDVI doesn’t necessarily mean there is anything you can do to fix it this year. Underperforming Area alerts you to the fields and areas of the fields that are performing below their historical potential. This will allow you to quickly find those fields and areas and make adjustments to get them back on target and protect yield.

Nutrient Deficiency

nutrient deficiency

As the crop grows, it can tell us more of what is wrong with it. This analytic finds the fields and areas of the fields where there is a nutrient deficiency so that issues can be addressed before grain fill.

Disease Stress

disease risk

In conjunction with the Thermal Stress, Disease Stress alert takes into account weather information to more precisely indicate the type of stress impacting the crop.

Thermal Stress

thermal risk

Using our thermal imagery, AGMRI can detect elevated heat patterns of the crop that indicate crop stress.

Crop Health

Crop Health

Get a complete view of your farms and fields and identify where yield potential is ranked highest to the lowest.

Weed Map & Weed Escape

weed escape

Know what fields and areas of the fields have weeds. With machine integration or based on planting date, be alerted to what fields have weeds that may be impacting yield.

Historical Field Performance

AGMRI creates 5 performance zones in each field based on the historical average of those zones. This data is used to compare the current season to help understand where you are underperforming from the zone potential.

Low Emergence

low emergence

Notification of what fields and areas of the field have poor emergence.

Stand Assessment

strand assessment

AGMRI detects the established rows and uses computer vision and machine learning to determine the best segment of row and compares the rest of the field to that segment to give you a relative map. If machine data is integrated, a stand population map is returned.

YOUR MESSAGE WAS SENT SUCCESSFULLY!

dots-horizontal

We have received your inquiry and we’ll be in touch with you soon

Thank you for contacting us.