dots-horizontal

Utilizing AGMRI for Informed Fungicide Decisions: Placement and Timing

Background

The grower in this case doesn’t routinely apply fungicide across his entire operation. This selective approach is driven by the need to maximize disease mitigation and return on investment. The challenge lies in identifying which fields require fungicide application, considering the presence of disease-conducive conditions. During this past season, the grower received a thermal stress alert from AGMRI, which prompted further scouting with his trusted agronomy advisor which led to the discovery of disease. This situation raised questions about when and where to apply fungicide for optimal results.

Challenge

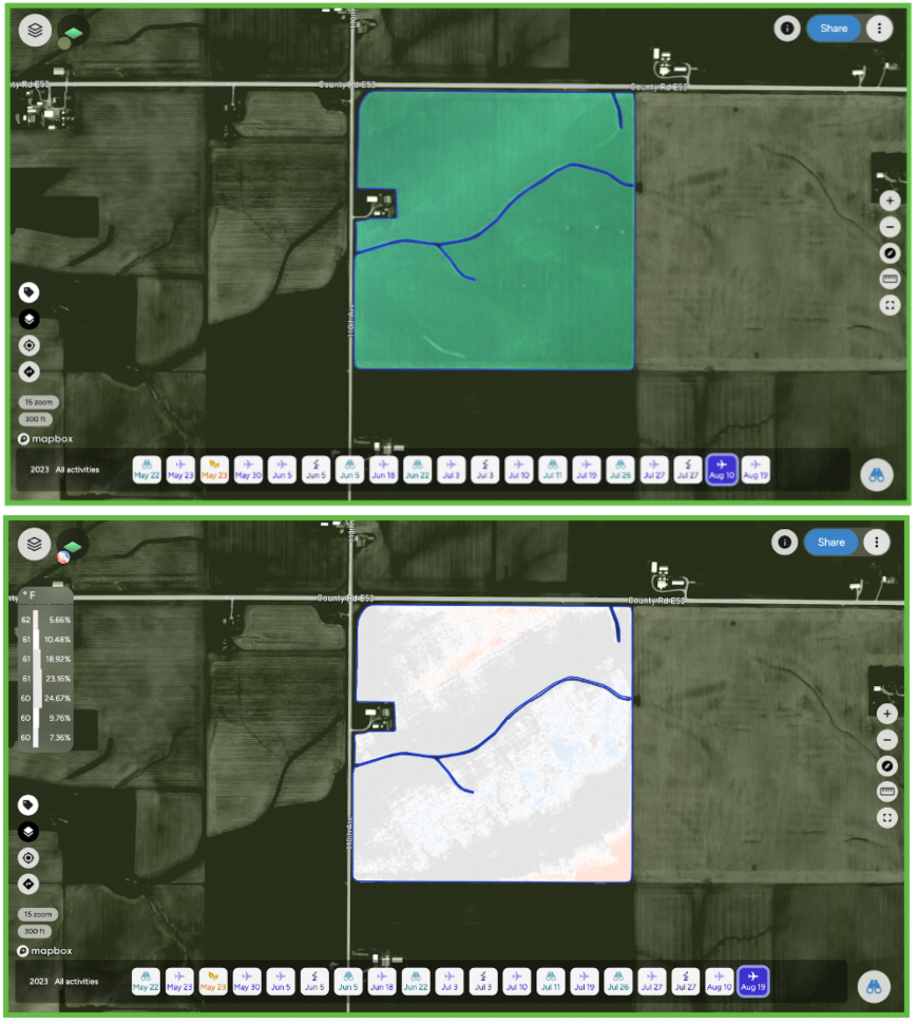
The main challenge was the grower’s need to make strategic decisions regarding fungicide placement and timing. While disease conditions were present, it was unclear which fields would benefit most from fungicide application. Failing to address this issue could result in potential yield loss. The grower was “on the fence” about fungicide application, and AGMRI’s data helped validate and evaluate the situation. The thermal stress, which showed a wind blown pattern on the thermal map was a key trigger for further investigation, leading to disease identification and the decision to apply fungicide.

Solution

AGMRI played a crucial role by alerting the grower to thermal stress conditions in the field. Subsequently, scouts were deployed to assess the situation, identifying the presence of disease. This data informed the decision to apply fungicide in the affected field. AGMRI served as a reliable indicator of disease conditions, guiding the grower’s response.

Results

The ultimate results of this fungicide application will be known as harvest data is acquired. However, the proactive use of AGMRI in identifying and addressing disease conditions has the potential to improve disease mitigation and return on investment. In the future, the grower plans to continue leveraging AGMRI for in-season decisions on fungicide applications, prioritizing fields with the greatest need during busy times, and deploying scouts when necessary.


View the Full Use Case

Share This Article

RELATED BLOG POSTS

Yield Forecast

Understand where your corn yield is based on the current state of the crop. As the season unfolds, see how it is having an impact on your final yield.

Yield Loss

Powered by years of Nitrogen research at the University of Missouri, our corn Yield Loss analytic, powered by NVision Ag, gives insight into potential yield loss due to Nitrogen deficiency. Optional analytic for nitrogen management.

Variable Dry Down

variable dry down

Understand which fields and which areas of the field are drying down to help plan your harvest logistics.

Underperforming Area

low crop health

Not all areas of your fields perform the same and low NDVI doesn’t necessarily mean there is anything you can do to fix it this year. Underperforming Area alerts you to the fields and areas of the fields that are performing below their historical potential. This will allow you to quickly find those fields and areas and make adjustments to get them back on target and protect yield.

Nutrient Deficiency

nutrient deficiency

As the crop grows, it can tell us more of what is wrong with it. This analytic finds the fields and areas of the fields where there is a nutrient deficiency so that issues can be addressed before grain fill.

Disease Stress

disease risk

In conjunction with the Thermal Stress, Disease Stress alert takes into account weather information to more precisely indicate the type of stress impacting the crop.

Thermal Stress

thermal risk

Using our thermal imagery, AGMRI can detect elevated heat patterns of the crop that indicate crop stress.

Crop Health

Crop Health

Get a complete view of your farms and fields and identify where yield potential is ranked highest to the lowest.

Weed Map & Weed Escape

weed escape

Know what fields and areas of the fields have weeds. With machine integration or based on planting date, be alerted to what fields have weeds that may be impacting yield.

Historical Field Performance

AGMRI creates 5 performance zones in each field based on the historical average of those zones. This data is used to compare the current season to help understand where you are underperforming from the zone potential.

Low Emergence

low emergence

Notification of what fields and areas of the field have poor emergence.

Stand Assessment

strand assessment

AGMRI detects the established rows and uses computer vision and machine learning to determine the best segment of row and compares the rest of the field to that segment to give you a relative map. If machine data is integrated, a stand population map is returned.