As with every year, 2023 is not without its challenges. From planting and emergence issues to drought stress conditions and several other factors hampering the growth and development of crops, there is still a lot of valuable information that can be gained through imagery.
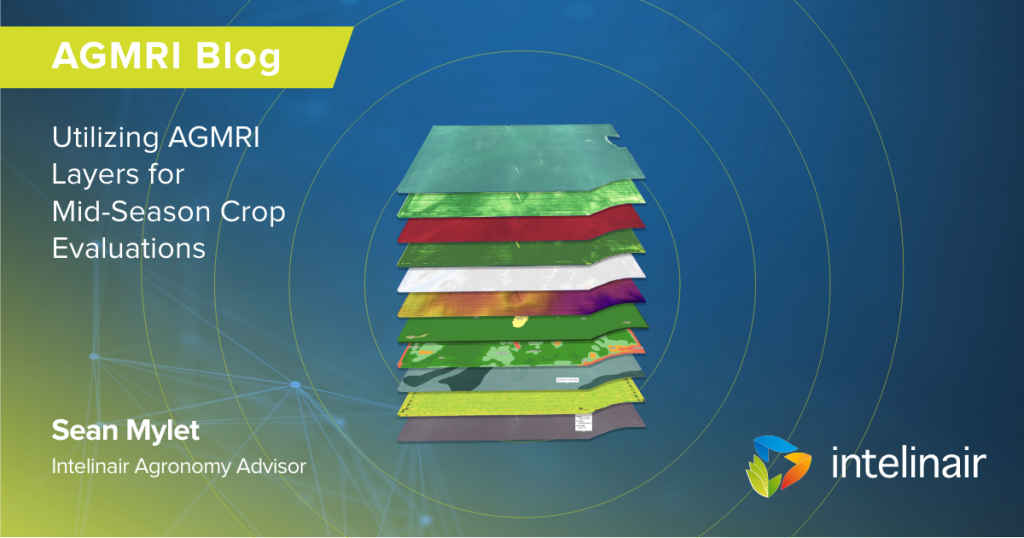
Through the various layers within AGMRI, a user can keep up to date on what is happening in fields and make timely decisions that can drive actions and get the most out of their crop. To benefit from all that AGMRI has to offer, it is first important to understand what imagery layers are available and how to use them. In doing so, you can then begin to better understand what is happening with your crop, which ultimately may drive decisions on crop management down the road. Within AGMRI, there are six layers:
- RGB
- NDVI
- Vegetation
- Thermal
- Color Infrared
- Topography
While all of these are useful on their own, the true power comes from using the layers together to help piece together a “story” about what is going on within a field at any given time during the season.
The RGB layer is your typical Red, Green, Blue image, which is most often the easiest map for users to read and identify. This particular layer uses a basic Red, Green, Blue color code and most closely resembles a regular picture image. This layer is useful throughout the season; however, it really shines in the mid – late season time frame as you can pick up a lot of insights as the crop canopy closes. Some typical issues that you can see are:
- Weather damage from wind
- Machine errors (i.e. planter skips, nutrient application errors, spray errors)
- Areas of nitrogen loss
While a basic imagery layer, it is incredibly valuable as it is simple to use but drives a lot of field insights.
The next layers – and perhaps the most used in determining overall crop health – are the NDVI layer and the vegetation layer. NDVI stands for normalized difference vegetation index, and is most useful for looking at plant health whenever the canopy closes. While it can be used to help track emergence by differentiating crops from soil in the early part of the season, a large portion of the value is from mid to late season usage. Through the use of a simple index from red (poor plant biomass) to green (higher plant biomass), the map is easy to read while still adding lots of value. Some uses include:
- Re–affirming emergence
- Poor plant biomass
- Nutrient deficiencies
- Herbicide drift injury
The vegetation map is closely related to the NDVI map and is used for many of the same points noted within the NDVI imagery layer. The vegetation map is best used when identifying poor emergence coupled with poor crop health. While the NDVI layer is coded with red being poor and green being best, the vegetation layer is coded with yellow being the worst and green being the best.
When thinking about this 2023 growing season in particular, a large portion of the midwest has experienced drought conditions. The lack of rainfall and moderately high temperatures is not a good combination for crop growth and weed suppression. Generally speaking, crop canopy can help “shade out” weeds and prevent growth and yield loss, however, without the growth of the crop, weeds can potentially cause more damage than a typical year. The infrared layer is extremely powerful in both determining weed pressure, and crop growth to canopy. The infrared layer uses color infrared technology to distinguish plant matter from the soil. Some great use cases include:
- Any emergence issues within a field
- Weed pressure
- Row canopy closure
- Planter skips
The final two layers in AGMRI also are best used together. The thermal and topographic layers are highly useful later on in the season, as they can potentially be used in unison to help determine the greatest area for disease pressure within an area. The topographic layer uses an active pulsed sensor laser light that measures the contour of a field. The thermal layer is most often used later in the season (VT – R3) to help determine where potential disease pressure may be moving in. By using red, blue, and gray color zones, you can determine “hot spots” within a field which can potentially indicate disease pressure moving in. Some typical use cases include:
Topography Layer
- Field slope and determining what direction water flows
- Tile lines early in the season
Thermal Layer
- Potential disease pressure
- Crop stress from heat
- Thermal stress from herbicide injury
By using all of these layers together, you can tell the story of what is happening within a particular field. As noted, the imagery layers have useful functionality by themselves; however, when used together, they can create a fuller analysis of what is occurring in the field.
If you have any questions or would like more information on AGMRI and how to use each layer, please contact your Territory Manager.


