dots-horizontal

Plan Field Work with AGMRI Weather Data

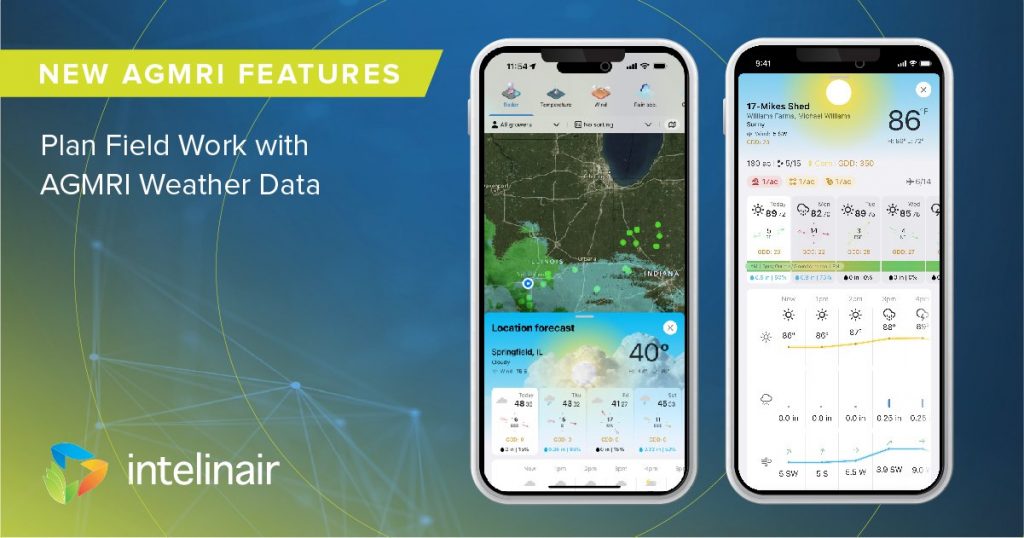
What will the weather be today? Didn’t catch the latest weather forecast? As farmers, crop advisors, and field scouts, many of our decisions are influenced by the weather. Fortunately, AGMRI can give you the weather tools you need to take action. The updated iPhone app features weather that allows users to observe weather conditions at a hyper-local field level all the way to regional views.


AGMRI Weather Key Features

The tool includes several new features:

  • Daily and Hourly Wind, Precipitation, and Temperature (Next 12 Hours)

  • Wind Speed and Spray Outlook

  • Ground Workability Estimation

  • Daily and Estimated Weekly GDD Accumulation

  • Rainfall Accumulation – last 24-48 hour and seasonal

Taking a country drive to check crop conditions is beneficial but can be time consuming.

Consider using AGMRI weather information when faced with these decisions:

  • After a rain event, prioritize where to send sprayers or other equipment

  • View weather trends for fields in different counties or further away

  • Check the estimated GDD and crop growth stage to see fields that may be ready for different spray passes (see figure below)

  • Compare seasonal rainfall of fields to see how it has affected crop growth

  • After powerful storms, check fields for storm damage

The chart above shows the number of fields for each crop at each growth stage.

Increase visibility of the many farm operation variables through the AGMRI app – a one-stop shop for a complete view of operation and field level information. Contact AGMRI to schedule a demo today and see how the app can increase efficiency on your operation.


Share This Article

RELATED BLOG POSTS

Yield Forecast

Understand where your corn yield is based on the current state of the crop. As the season unfolds, see how it is having an impact on your final yield.

Yield Loss

Powered by years of Nitrogen research at the University of Missouri, our corn Yield Loss analytic, powered by NVision Ag, gives insight into potential yield loss due to Nitrogen deficiency. Optional analytic for nitrogen management.

Variable Dry Down

variable dry down

Understand which fields and which areas of the field are drying down to help plan your harvest logistics.

Underperforming Area

low crop health

Not all areas of your fields perform the same and low NDVI doesn’t necessarily mean there is anything you can do to fix it this year. Underperforming Area alerts you to the fields and areas of the fields that are performing below their historical potential. This will allow you to quickly find those fields and areas and make adjustments to get them back on target and protect yield.

Nutrient Deficiency

nutrient deficiency

As the crop grows, it can tell us more of what is wrong with it. This analytic finds the fields and areas of the fields where there is a nutrient deficiency so that issues can be addressed before grain fill.

Disease Stress

disease risk

In conjunction with the Thermal Stress, Disease Stress alert takes into account weather information to more precisely indicate the type of stress impacting the crop.

Thermal Stress

thermal risk

Using our thermal imagery, AGMRI can detect elevated heat patterns of the crop that indicate crop stress.

Crop Health

Crop Health

Get a complete view of your farms and fields and identify where yield potential is ranked highest to the lowest.

Weed Map & Weed Escape

weed escape

Know what fields and areas of the fields have weeds. With machine integration or based on planting date, be alerted to what fields have weeds that may be impacting yield.

Historical Field Performance

AGMRI creates 5 performance zones in each field based on the historical average of those zones. This data is used to compare the current season to help understand where you are underperforming from the zone potential.

Low Emergence

low emergence

Notification of what fields and areas of the field have poor emergence.

Stand Assessment

strand assessment

AGMRI detects the established rows and uses computer vision and machine learning to determine the best segment of row and compares the rest of the field to that segment to give you a relative map. If machine data is integrated, a stand population map is returned.