This is the second of a three-part series reviewing varied factors of crop production – including inputs, weather, and the predicted market direction – that may influence 2023 season outcomes culminating with the crop harvest.
Weather and its Impact on Yield Potential
Perhaps no other variable in crop production provides for as much discussion as does weather – which we can do little to control. Yet, the impact of weather – the short term hourly, daily, and weekly variations – have a direct influence on the outcome of all production seasons. Weather is thought of as short term, while climate is thought of as longer term. I focus here on the weather and its potential impact for the 2023 season.
Quantifying the impact of weather on crop production, according to a study on corn yield from Dr. Fred Below, professor of crop physiology at the University of Illinois, adverse weather events at critical times in the growth of a corn crop can result in a loss of yield potential of up to 70 bu/acre* on base yield of 260 bu/acre. This study and others have demonstrated the impact of weather variability on the yield potential of various crops.
Understanding the stage of the crop, having an awareness of weather conditions – including the departure from normal of both temperatures and moisture, and knowledge of any expected weather trends, can give farmers a perspective to make decisions regarding any additional in-season inputs for particular fields relative to yield goals and the baseline expectations regarding the crop potential as the season progresses.
Weather Predictions – 2023 Season
As most involved with production agriculture know, the El Niño-Southern Oscillation (ENSO) is a recurring pattern involving changes in the temperature of the waters in the central and eastern tropical Pacific Ocean, which is one of the main drivers to weather patterns across North America. The ENSO varies in phases, with La Nina being the “negative” side of the ENSO. During a La Nina phase, sea-surface temperatures in the tropical Pacific Ocean are lower than normal. During the El Nino phase, sea-surface temperatures move higher than normal, both of which impact the weather patterns that develop during the growing season.
Recent updates from NOAA, the National Oceanic and Atmospheric Administration, indicate that for the 2023 season, the current La Nina is weakening and moving to more “neutral” conditions through the spring and early summer. At that point, we could see movement to potentially more El Nino like conditions later in the summer. Prior growing seasons that saw the end of a La Nina pattern were generally in-line with expectations on a national basis, with areas of variability.
Some highlights of the weather this season, could include:
-
Periods of the early season when colder temperatures may limit the amount of early planting in some areas – depending upon farmers normally begin to plant
-
Less likelihood to see broad areas of consistent wetness or dryness
-
More potential variability in-season with weather events – some areas benefiting from weather patterns, with others not being as fortunate on a local basis
-
A greater likelihood of more typical summer thunderstorm patterns in the eastern Corn Belt – some areas benefiting from timely rainfall, while others are missed
-
Periods within the season with heat waves as well as time periods where the heat breaks – a “normal” summer
How AGMRI Can Help
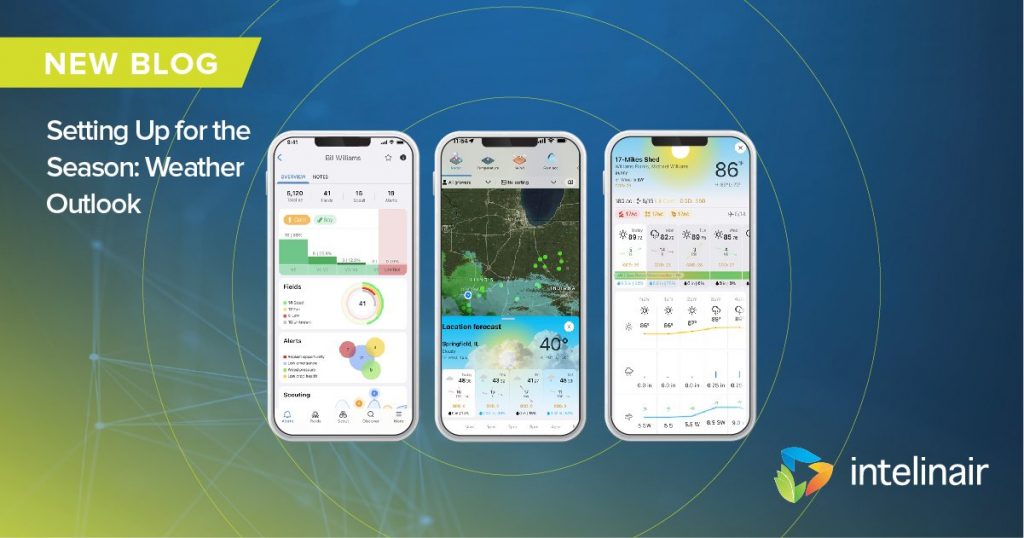
AGMRI delivers the weather tools you need to take action. The updated iPhone app enables users to observe weather conditions at the hyper-local field level all the way to regional views. Check the estimated GDD and crop growth stage to see fields that may be ready for different spray passes, compare seasonal rainfall of fields to see how it affected crop growth, and check fields for damage after powerful storms.
For additional information on how AGMRI can allow you to more effectively understand your crop’s status in order to make timely in-season decisions, contact us.


