dots-horizontal

Wet Spring Leads to Replant Opportunity

When too much rain strikes, it can be difficult to monitor conditions across an operation or even region. Not to mention the added stress of the reduced timeline to get those replant acres in.


In 2021, AGMRI proved helpful in a number of ways for customers using the platform. Not only was AGMRI able to identify needs for replant, confirm the information with imagery and integrate into equipment for efficient replants, the information was used to monitor the replants progress all season.

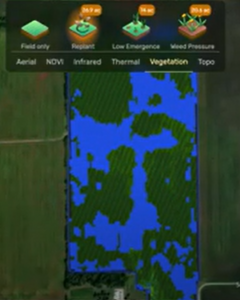
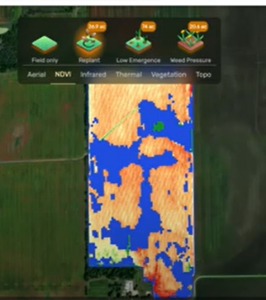
“Using our dashboard, we were able to work with our customer to review the alerts and then verify – using CIR – that the rows were actually in need of replant,” says Conner Schmidt, account manager for Intelinair. “Since our system integrates with equipment like myJohnDeere and Climate FieldView, the farmer was able to go directly to the area that needed replant and move on.”


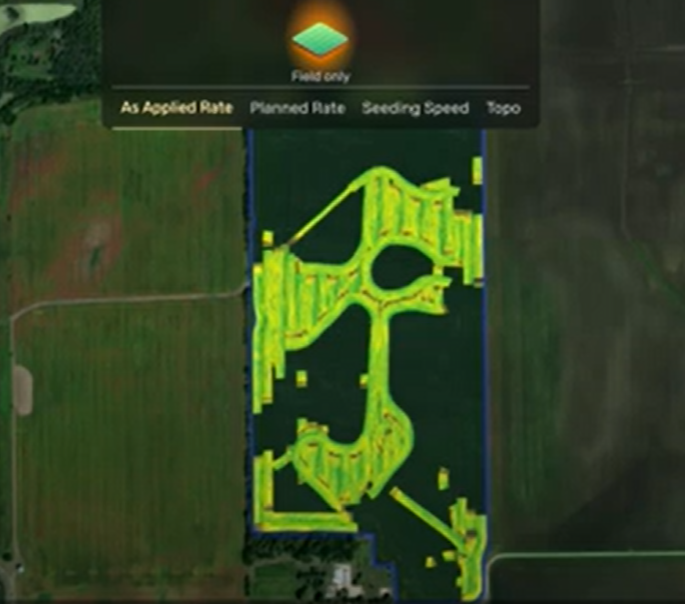
By using AGMRI and integrating with existing equipment, the customer was able to send the replant needs directly to the tractor and to follow the path within the field.

“In the past, you’d have to travel across the whole field picking up or dropping the planter where you felt you needed a replant,” adds Schmidt. “Now, we’re going directly to that spot in the field and only driving where needed.”

The customer saw results. They were able to more than double their output related to replant acres moving from 10 acres per hour to 21 acres per hour with the integration.


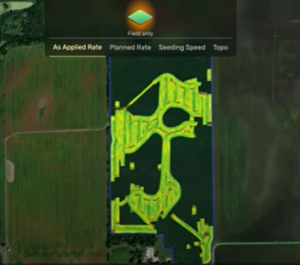
With AGMRI, they were also able to monitor the progress of those replants throughout the season and know exactly where in the field those replants happened for assessing overall production at the end of the year.

Share This Article

RELATED BLOG POSTS

Yield Forecast

Understand where your corn yield is based on the current state of the crop. As the season unfolds, see how it is having an impact on your final yield.

Yield Loss

Powered by years of Nitrogen research at the University of Missouri, our corn Yield Loss analytic, powered by NVision Ag, gives insight into potential yield loss due to Nitrogen deficiency. Optional analytic for nitrogen management.

Variable Dry Down

variable dry down

Understand which fields and which areas of the field are drying down to help plan your harvest logistics.

Underperforming Area

low crop health

Not all areas of your fields perform the same and low NDVI doesn’t necessarily mean there is anything you can do to fix it this year. Underperforming Area alerts you to the fields and areas of the fields that are performing below their historical potential. This will allow you to quickly find those fields and areas and make adjustments to get them back on target and protect yield.

Nutrient Deficiency

nutrient deficiency

As the crop grows, it can tell us more of what is wrong with it. This analytic finds the fields and areas of the fields where there is a nutrient deficiency so that issues can be addressed before grain fill.

Disease Stress

disease risk

In conjunction with the Thermal Stress, Disease Stress alert takes into account weather information to more precisely indicate the type of stress impacting the crop.

Thermal Stress

thermal risk

Using our thermal imagery, AGMRI can detect elevated heat patterns of the crop that indicate crop stress.

Crop Health

Crop Health

Get a complete view of your farms and fields and identify where yield potential is ranked highest to the lowest.

Weed Map & Weed Escape

weed escape

Know what fields and areas of the fields have weeds. With machine integration or based on planting date, be alerted to what fields have weeds that may be impacting yield.

Historical Field Performance

AGMRI creates 5 performance zones in each field based on the historical average of those zones. This data is used to compare the current season to help understand where you are underperforming from the zone potential.

Low Emergence

low emergence

Notification of what fields and areas of the field have poor emergence.

Stand Assessment

strand assessment

AGMRI detects the established rows and uses computer vision and machine learning to determine the best segment of row and compares the rest of the field to that segment to give you a relative map. If machine data is integrated, a stand population map is returned.