dots-horizontal

Zoning and Yield Estimation: New Features for AGMRI

Zone management and yield estimates are part of the job, but not always easy. AGMRI recently released two new features that enable users to quickly zone their fields and estimate their yields: the Precision Zoning Tool and the Yield Estimate Scouting Tool.


Precision Zoning Tool

The Precision Zoning Tool allows farmers to generate customized zoning maps for their fields that can be used to plan and apply variable rate applications throughout the season. Using NDVI analytics from AGMRI, the tool automatically segments fields into different zones based on potential crop productivity. This new tool allows users to make informed decisions about input applications – how much, where and when – to address issues in the field. This has the potential to reduce input costs and save time.

An NDVI image of a field (left), and a 3-zone map generated with the Precision Zoning Tool showing field variability (right).

The Precision Zoning Tool has the ability to export zoning maps with precision application directions directly to John Deere’s Operations Center (JDLink). Currently, AGMRI can export seeding, nutrient, and herbicide application prescriptions.


Yield Estimate Scouting Tool

With the improved Yield Estimate Scouting Tool, farmers have a quick and easy way to estimate their field’s yield potential. With this tool, farmers scout representative areas of their field and input their observations into the scouting tool. AGMRI will use the inputs to make the yield estimate calculations. Farmers can also choose an option in the tool to allow AGMRI to  automatically select areas of the field to calculate yield potential estimates.

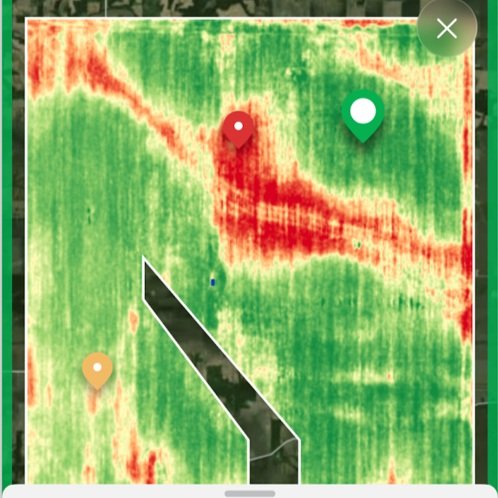
User generated information from scouting while using the AGMRI Yield Estimate Scouting Tool.


AGMRI generated a yield estimate from three points.


Once the estimation is complete, AGMRI will create a 3-D yield estimate map which the users can view as an overlay to any other image layer. This helps farmers consider what might be affecting the yield potential of the various regions in their field by comparing it with soil, topography, NDVI, and more.

These two tools can help optimize inputs throughout the season, as well as set expectations for harvest.


Ready to get started with AGMRI?

Start the conversation today: CONTACT US. 

Share This Article

RELATED BLOG POSTS

Yield Forecast

Understand where your corn yield is based on the current state of the crop. As the season unfolds, see how it is having an impact on your final yield.

Yield Loss

Powered by years of Nitrogen research at the University of Missouri, our corn Yield Loss analytic, powered by NVision Ag, gives insight into potential yield loss due to Nitrogen deficiency. Optional analytic for nitrogen management.

Variable Dry Down

variable dry down

Understand which fields and which areas of the field are drying down to help plan your harvest logistics.

Underperforming Area

low crop health

Not all areas of your fields perform the same and low NDVI doesn’t necessarily mean there is anything you can do to fix it this year. Underperforming Area alerts you to the fields and areas of the fields that are performing below their historical potential. This will allow you to quickly find those fields and areas and make adjustments to get them back on target and protect yield.

Nutrient Deficiency

nutrient deficiency

As the crop grows, it can tell us more of what is wrong with it. This analytic finds the fields and areas of the fields where there is a nutrient deficiency so that issues can be addressed before grain fill.

Disease Stress

disease risk

In conjunction with the Thermal Stress, Disease Stress alert takes into account weather information to more precisely indicate the type of stress impacting the crop.

Thermal Stress

thermal risk

Using our thermal imagery, AGMRI can detect elevated heat patterns of the crop that indicate crop stress.

Crop Health

Crop Health

Get a complete view of your farms and fields and identify where yield potential is ranked highest to the lowest.

Weed Map & Weed Escape

weed escape

Know what fields and areas of the fields have weeds. With machine integration or based on planting date, be alerted to what fields have weeds that may be impacting yield.

Historical Field Performance

AGMRI creates 5 performance zones in each field based on the historical average of those zones. This data is used to compare the current season to help understand where you are underperforming from the zone potential.

Low Emergence

low emergence

Notification of what fields and areas of the field have poor emergence.

Stand Assessment

strand assessment

AGMRI detects the established rows and uses computer vision and machine learning to determine the best segment of row and compares the rest of the field to that segment to give you a relative map. If machine data is integrated, a stand population map is returned.