dots-horizontal

Use Case: Nitrogen Deficiency Detection Leads to Equipment Upgrade to Prevent Future Yield Loss

Background

An Indiana grower had experienced repeated issues with his sidedress toolbar in past seasons but had not previously adjusted as a result. This season, he completed all sidedress applications on his corn before discovering a plugged knife while cleaning the equipment.

The timing of the discovery meant the nitrogen application had already been completed, leaving potential issues undiscovered during the critical sidedress period. Historically, the grower hadn’t had a way to easily identify problems like this in-season before yield impacts occurred.

Challenge

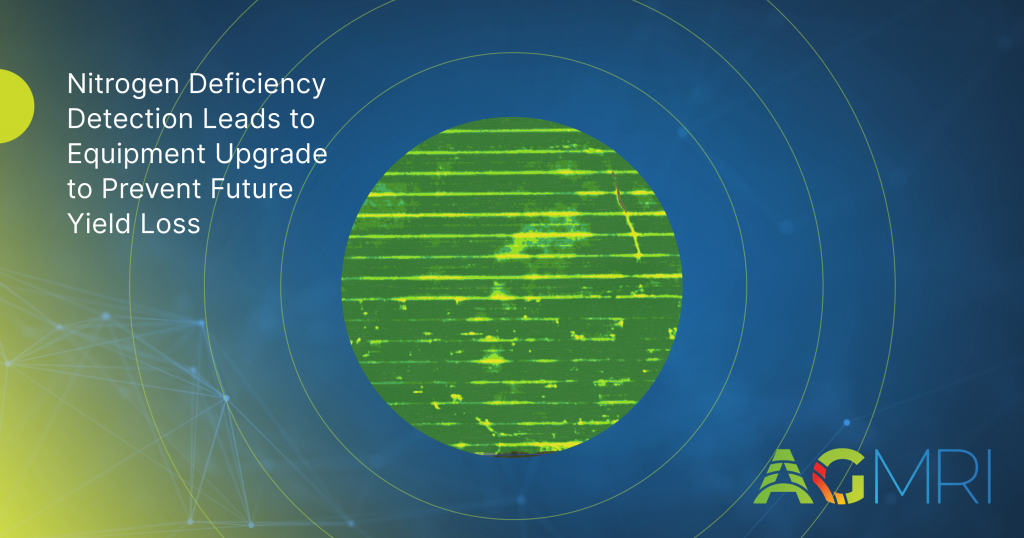
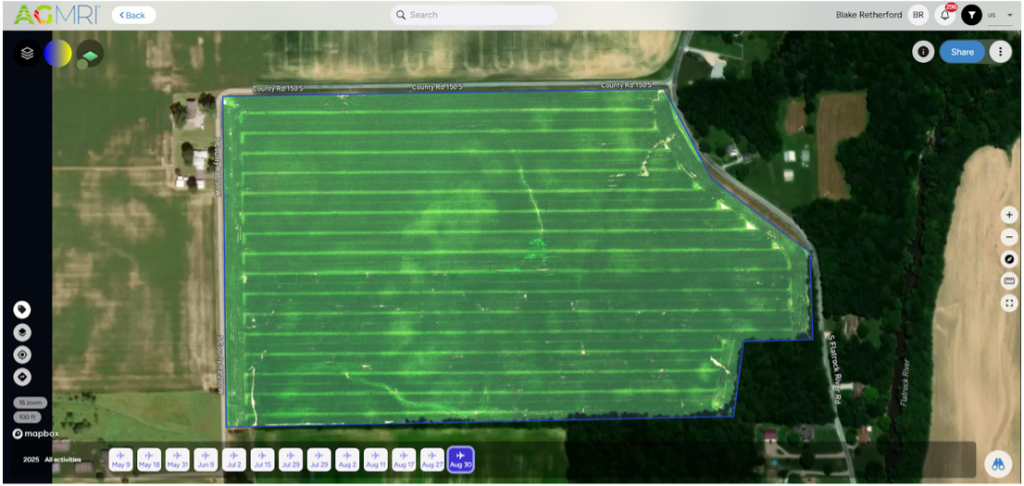
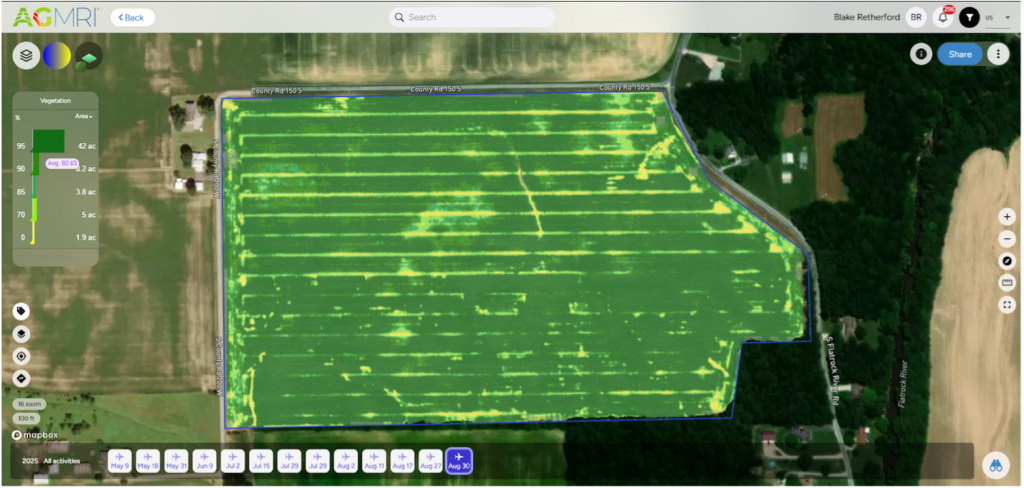
The plugged knife on the sidedress toolbar caused nitrogen deficiencies in 3–4 rows every 35 feet across all corn fields. These deficiencies were not immediately visible and would have likely persisted unnoticed until late in the season or at harvest.

Left unresolved, the nitrogen gap in these strips could lead to a significant yield drag of up to 15 bu/acre, reducing profitability across a large number of acres. The grower needed a way to identify and quantify the extent of the issue after the fact to inform future management and equipment decisions.

Solution

Using AGMRI, the nitrogen-deficient rows were clearly detected across the affected fields. The imagery revealed consistent striping patterns corresponding to the plugged knife’s impact, validating the cause of the deficiency.

Drawing from similar documented cases, the agronomic team estimated the potential yield loss tied to the issue, providing the grower with actionable data. This insight gave him the clarity to address the root cause and make equipment improvements.

Results

Armed with this data, the grower decided to purchase a new sidedress toolbar to eliminate recurring application problems. By upgrading his equipment, he aims to prevent similar nitrogen issues in future seasons, ensuring more uniform applications and reducing avoidable yield loss.

Share This Article

RELATED BLOG POSTS

[pdf-embedder url=”https://www.intelinair.com/wp-content/uploads/2024/10/Topography-Layer.pdf”

Yield Forecast

Understand where your corn yield is based on the current state of the crop. As the season unfolds, see how it is having an impact on your final yield.

Yield Loss

Powered by years of Nitrogen research at the University of Missouri, our corn Yield Loss analytic, powered by NVision Ag, gives insight into potential yield loss due to Nitrogen deficiency. Optional analytic for nitrogen management.

Variable Dry Down

variable dry down

Understand which fields and which areas of the field are drying down to help plan your harvest logistics.

Underperforming Area

low crop health

Not all areas of your fields perform the same and low NDVI doesn’t necessarily mean there is anything you can do to fix it this year. Underperforming Area alerts you to the fields and areas of the fields that are performing below their historical potential. This will allow you to quickly find those fields and areas and make adjustments to get them back on target and protect yield.

Nutrient Deficiency

nutrient deficiency

As the crop grows, it can tell us more of what is wrong with it. This analytic finds the fields and areas of the fields where there is a nutrient deficiency so that issues can be addressed before grain fill.

Disease Stress

disease risk

In conjunction with the Thermal Stress, Disease Stress alert takes into account weather information to more precisely indicate the type of stress impacting the crop.

Thermal Stress

thermal risk

Using our thermal imagery, AGMRI can detect elevated heat patterns of the crop that indicate crop stress.

Crop Health

Crop Health

Get a complete view of your farms and fields and identify where yield potential is ranked highest to the lowest.

Weed Map & Weed Escape

weed escape

Know what fields and areas of the fields have weeds. With machine integration or based on planting date, be alerted to what fields have weeds that may be impacting yield.

Historical Field Performance

AGMRI creates 5 performance zones in each field based on the historical average of those zones. This data is used to compare the current season to help understand where you are underperforming from the zone potential.

Low Emergence

low emergence

Notification of what fields and areas of the field have poor emergence.

Stand Assessment

strand assessment

AGMRI detects the established rows and uses computer vision and machine learning to determine the best segment of row and compares the rest of the field to that segment to give you a relative map. If machine data is integrated, a stand population map is returned.

YOUR MESSAGE WAS SENT SUCCESSFULLY!

dots-horizontal

We have received your inquiry and we’ll be in touch with you soon

Thank you for contacting us.