What is it?
The AI Agent is a conversational agronomic assistant that helps advisors and growers analyze field data and generate insights in real time. Instead of navigating multiple dashboards, users can ask questions in natural language—or collaborate with the system on an analysis—and receive field-specific insights based on connected agronomic data such as:
- Crop plans
- Soil data
- Imagery
- Product applications
- Historical field performance
Where do I find it?
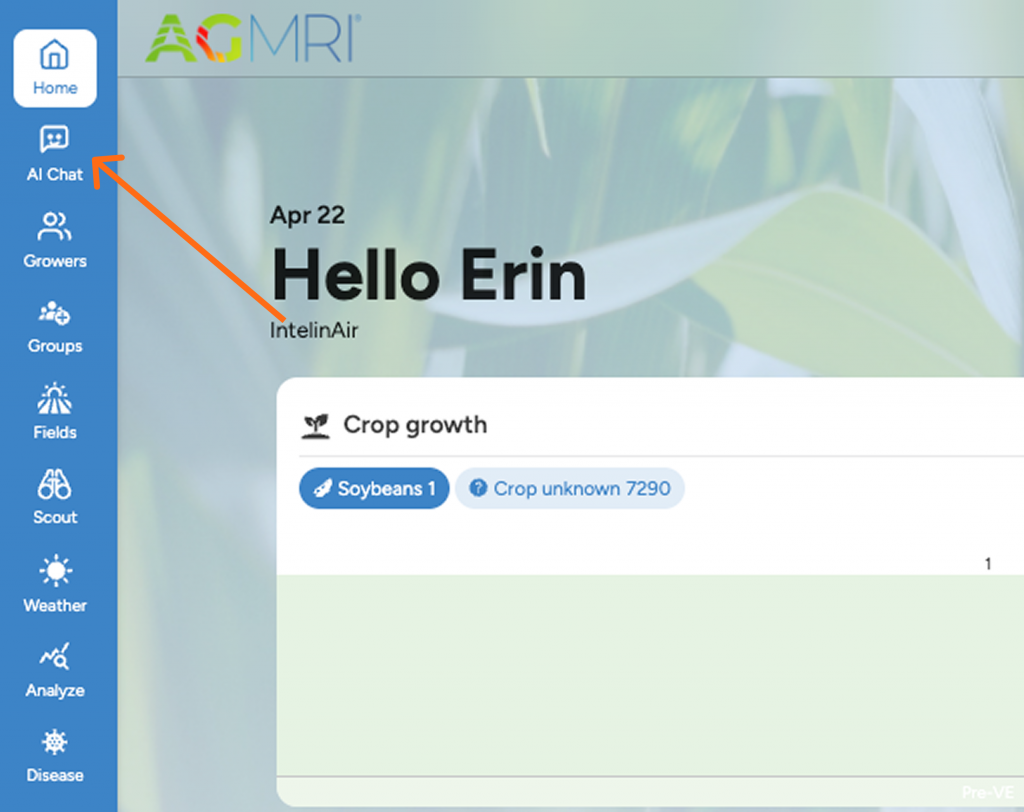
↑ On the web: Access the AI Chat in the upper left corner of the dashboard.
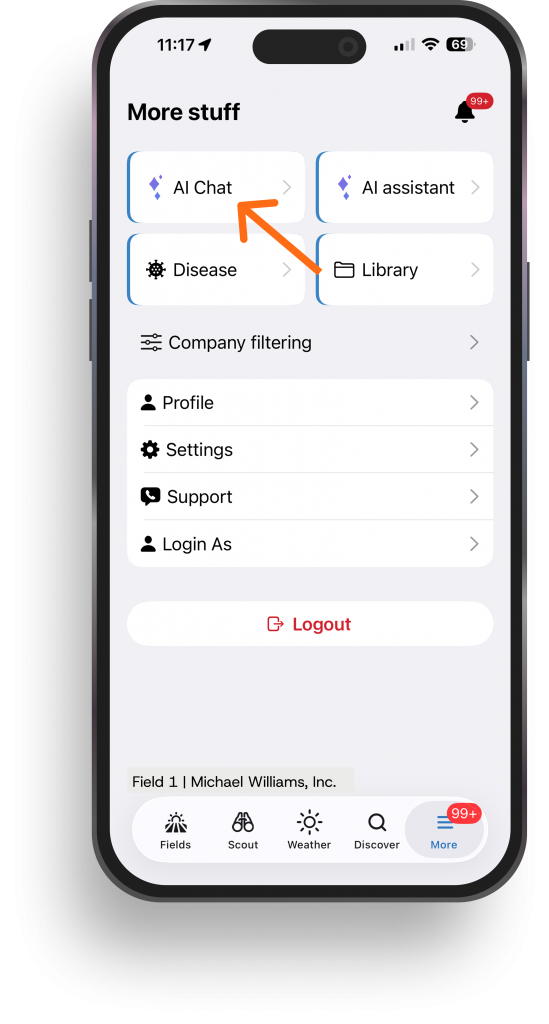
→ In the app: Navigate to more and choose AI Chat.
Start your conversation!
Questions to Ask
The AI is built to answer real agronomic and business questions, such as:
- Should fungicide be applied in this field?
- Which hybrids perform best on different soil types?
- Where are the biggest yield gaps across this operation?
- What is the expected ROI of a product application?
- What changed in underperforming fields year-over-year?
Here are some example starter prompts:
- Grower Performance Overview: “Give me a performance overview for [GROWER NAME] in [YEAR]. Include yield summary, field count, crop mix, and top and bottom fields.”
- Hybrid Performance Comparison: “Compare hybrid performance for [GROWER NAME] in [YEAR]. I want to see yield by soil productivity tier. Focus on [corn/soybeans]. The hybrids I care about most are [HYBRID 1, HYBRID 2, HYBRID 3].”
- Weather Planning: “What’s the weather forecast for [COUNTY, STATE] this week? I’m planning [planting/ spraying/harvest] and need to know about [rain/wind/temperature].”
What it Can Access
- Yield Data
- Hybrid Info
- Weather
- Plant Performance
- Soil Tests
- Products
- Imagery
What it Can Build for You
- Charts & Tables
- Shareable reports
- Prescription (.shp)*
- Zone & Heat Maps
- ROI Calculators
- Field Map Links
* Prescriptions
AI Agent includes the ability to generate shapefile-based recommendations. Shapefile outputs should be considered a beta feature; we cannot guarantee the accuracy of shapefile recommendation. We strongly advise human verification before execution.
7 Key Components of an LLM System
A plain-language chart explaining the major components of an LLM system using practical farm and agronomy analogies.
Custom Agent
Description: Who’s talking to you
Details: Standard gives you a general-purpose analyst. Custom means your co-op or retailer has its own version tuned to how your team works.
Example: Like texting your local agronomist who’s walked your fields for 10 years, instead of calling an 800 number.
Data
Description: What they know about your farm
Details: All the information about your fields, such as yield maps, planting history, soil types, weather, inputs, and harvest data. Custom adds your own proprietary layers.
Example: The county plat book plus your grandpa’s drainage tile maps and 20 years of yield books.
Memory
Description: What they remember from last time
Details: The system remembers your preferences, what you worked on, and what’s still on the to-do list so you never have to re-explain your operation.
Example: “Remember that wet spot on the south 80 we talked about in November?” — and it does.
Analysis
Description: How they think through problems
Details: Compares hybrids, checks if yield differences are real or just better dirt, and screens out bad data. Thinks like a good agronomist, not a calculator.
Example: “Did that hybrid actually do better?” It checks soil, rain, and population before answering.
Skills
Description: Ready-made reports they can run
Details: Pre-built analyses that run with one click, generating hybrid report cards, field comparisons, yield gap breakdowns. Custom skills match how your retailer does business.
Example: Standard plays every team runs, plus the trick plays your coach drew up for your team.
Artifacts
Description: The finished product you can hold
Details: Charts, dashboards, maps, and tables you look at. Share with your landlord or hand to your agronomist at the kitchen table.
Example: A clean, color-coded map of your farm you’d tape to the shop wall or email to your cash rent landlord.
Knowledge
Description: The textbook they can look things up in
Details: Reference material the system can pull from: growing degree day requirements, soil test interpretations, disease pressure thresholds, seed trait matrices, and Extension research. Your agronomist doesn’t just know your farm—they know the science behind the answer.
Example: A sharp agronomist with the Purdue Extension bulletins, the seed trait matrix, and 30 years of plot data sitting right next to him.


