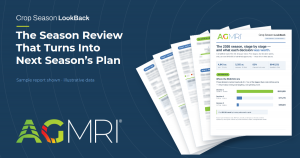
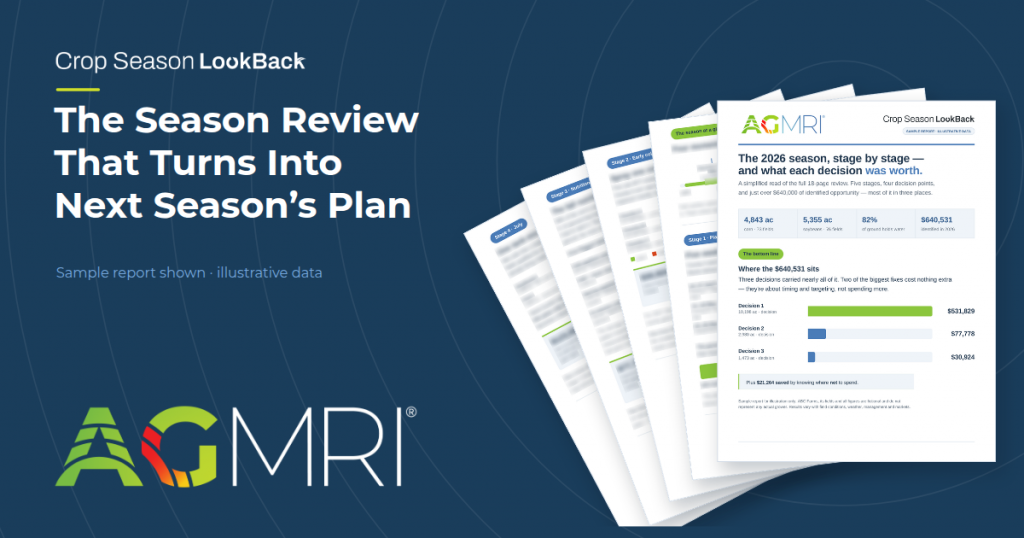

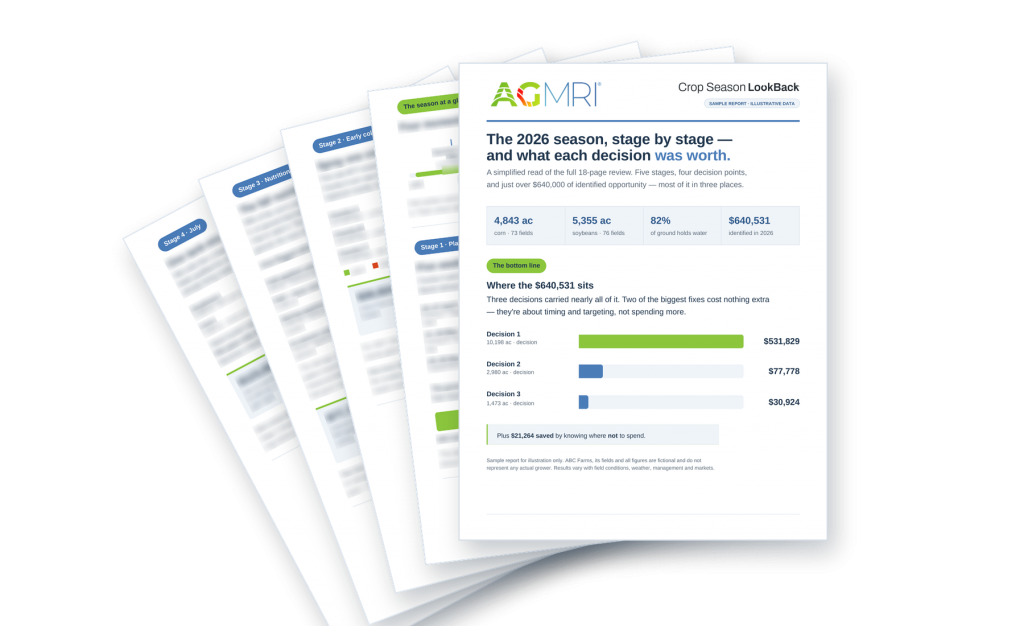
Crop Season LookBack: The Season Review That Turns Into Next Season's Plan. Fanned pages of a sample AGMRI report on a navy background.
dots-horizontal

The Season Review That Turns Into Next Season’s Plan: Inside the AGMRI LookBack Report

Published: October 8, 2026

By: Conner Schmidt

The AGMRI LookBack Report now does more than review a season. It maps every in-season decision and turns the findings into next year’s plan.

A season review used to mean a yield map and a conversation. Good ground, bad ground, a few guesses about why. The AGMRI LookBack Report was built to do more than that: walk a season in order (planting, hybrid response, nutrition, mid-season, harvest) and put a number on what each decision was worth. That’s still true. What’s new is what happens after the review is read.

The LookBack Report has grown from a static account of the season into an interactive workspace that a grower and their trusted advisor can work through together, field by field, and carry directly into next year’s plan. That’s a meaningful step up in what a season review can do for grower-level management decision-making, and it’s an expanded capability for Intelinair.
A season, read in order, not just at the end

The report is built from your farm’s AGMRI’s season-long aerial and satellite imagery and field analytics, alongside the planting and harvest records that give them context. Rather than compress all of that into one number, it’s organized into a set of focused analyses that each answer one question about the season:

  • overall hybrid performance across the operation
  • how well hybrid placement matched each field’s soil and conditions
  • where moisture ran short or sat wet
  • where the crop showed nutrient stress before a pass closed
  • where disease pressure and hybrid genetics lined up
  • which fields held their color late, and
  • where harvest timing, phantom yield loss, and logistics impact your operation
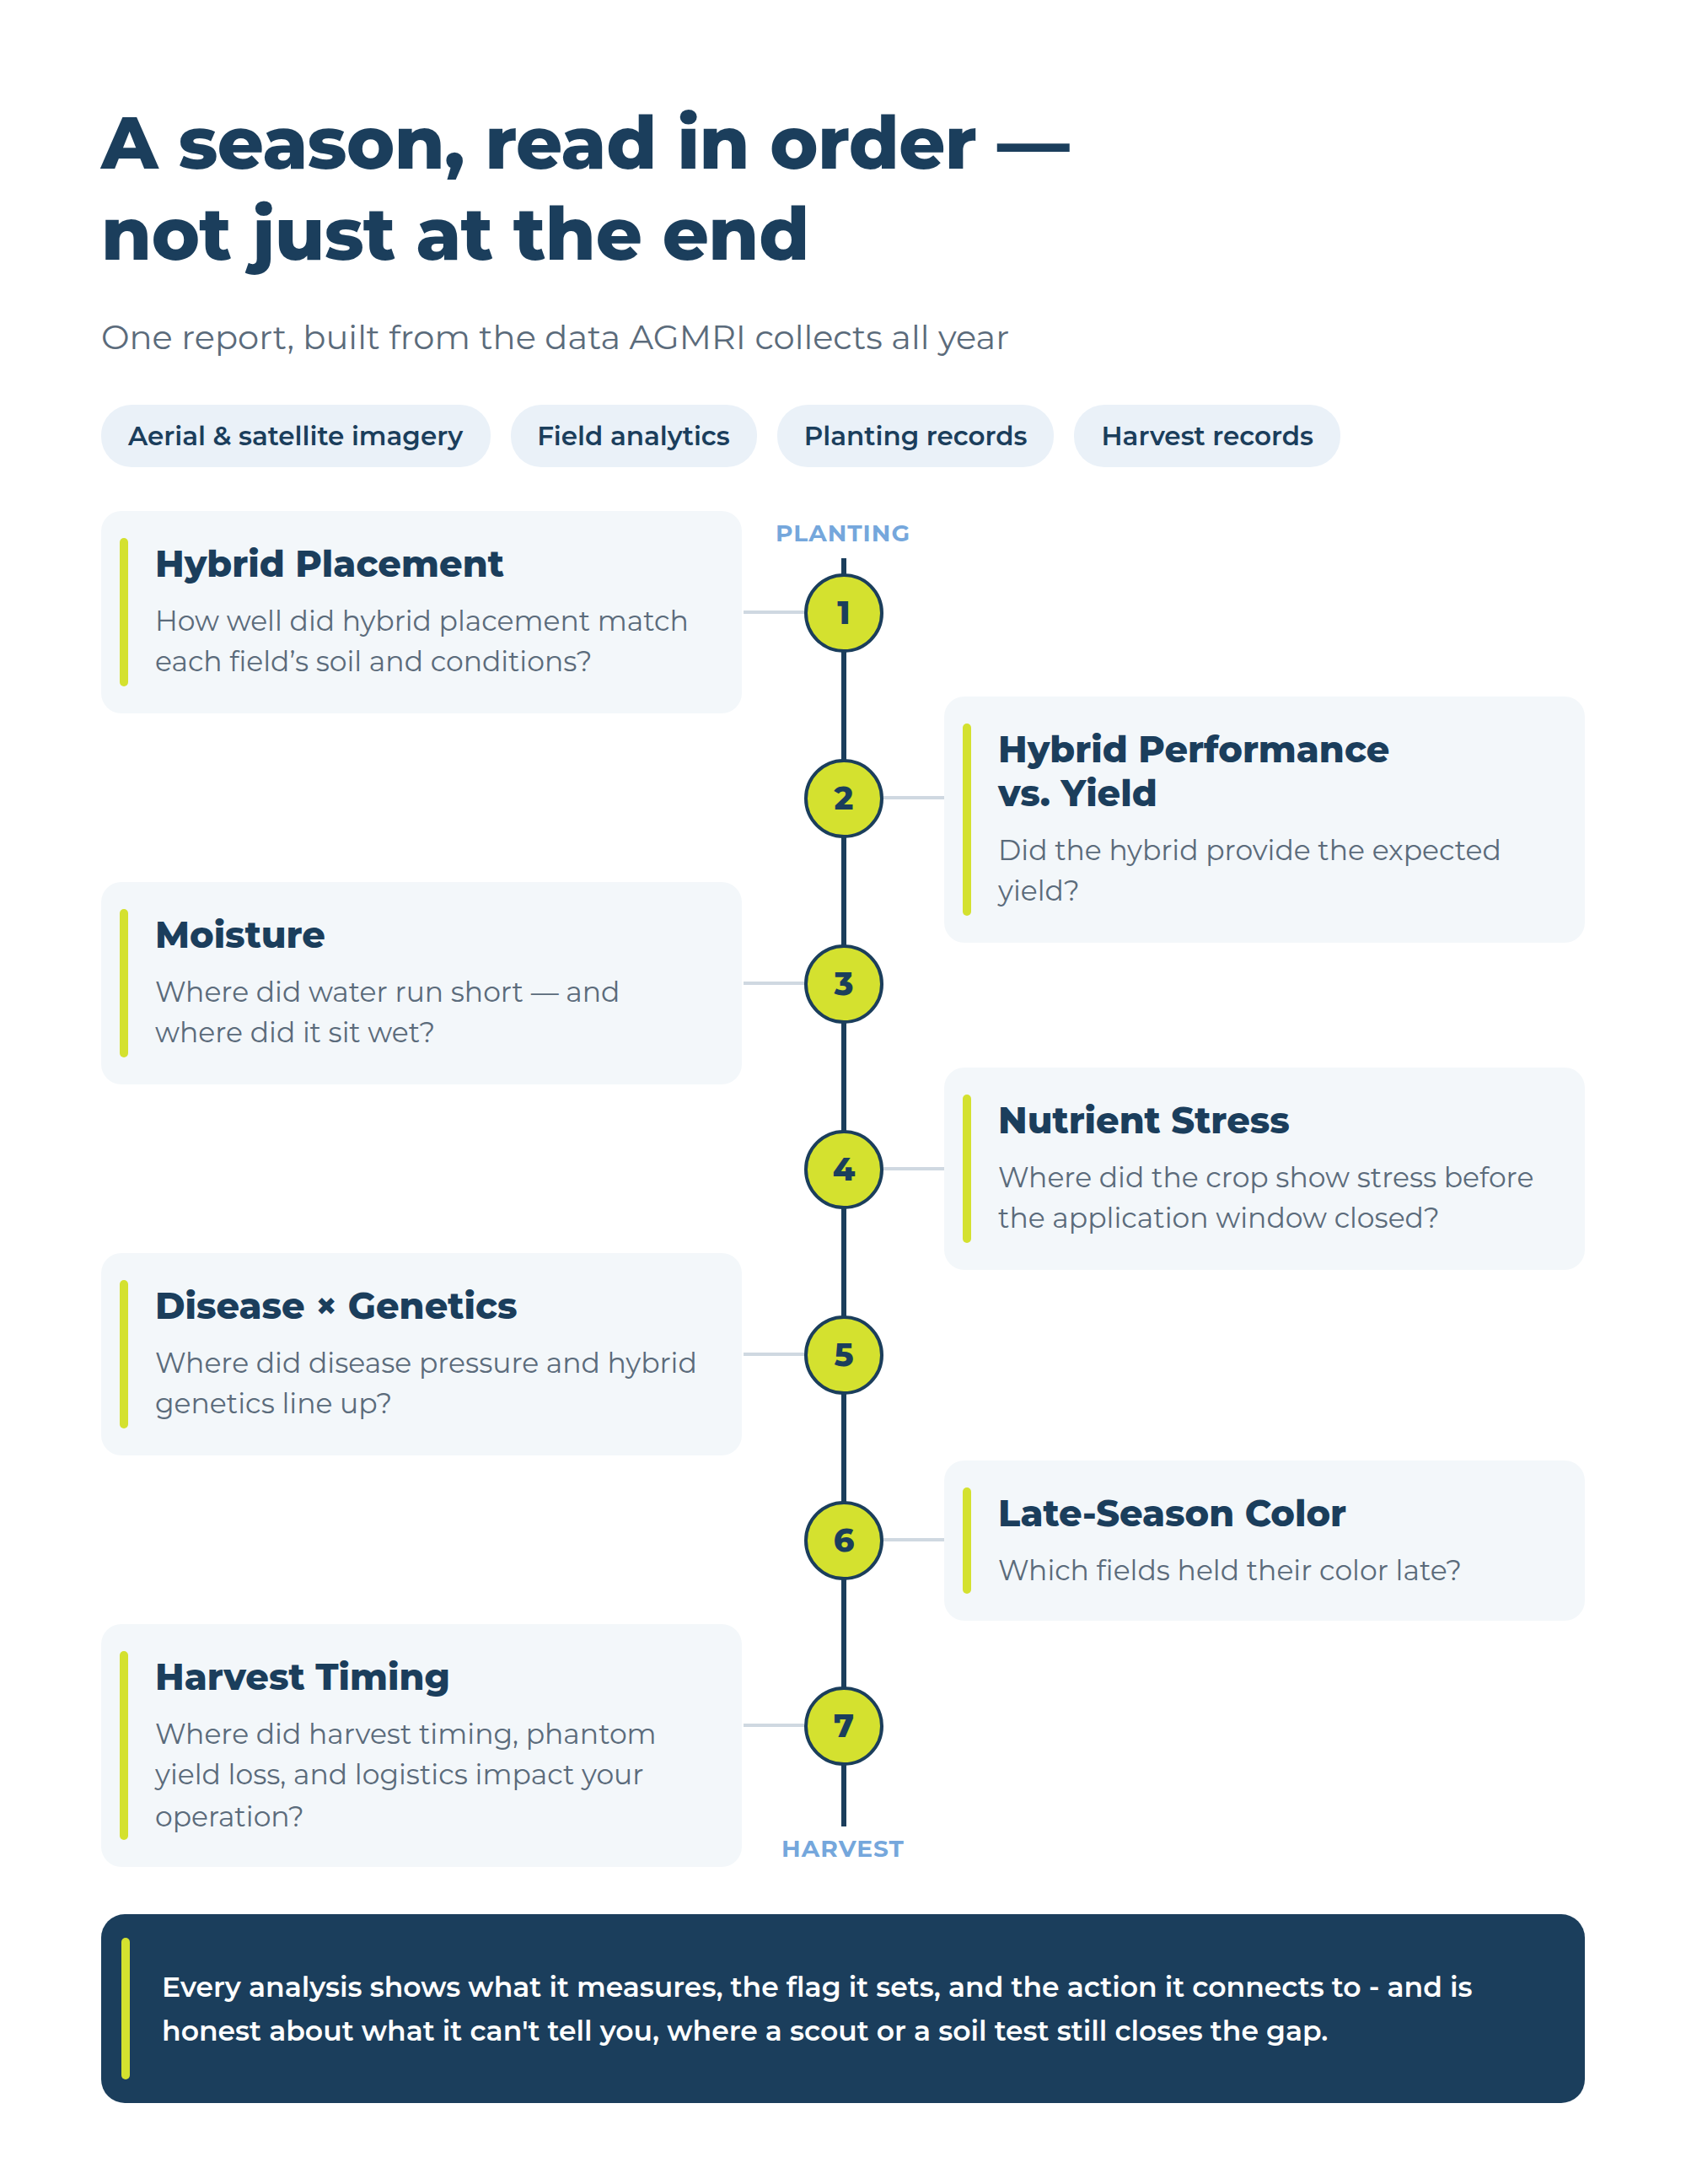
Seven-step AGMRI season timeline from planting to harvest: hybrid placement, hybrid performance vs. yield, moisture, nutrient stress, disease × genetics, late-season color, harvest timing.
Seven questions, asked in the order the season asks them; each one flagged while there's still time to act on it, or captured for next year's plan.

Each analysis is transparent about its own limits, showing:

  • what it measures
  • what flag it sets
  • how that flag connects to an action

That discipline is what makes the report usable for management decisions.

Hybrids and varieties, graded on this operation’s soil

The report rolls up performance by genetics: how each hybrid or variety performed on wet ground, dry ground, and under disease pressure, and where it ran ahead of or behind the farm average. What it did on this farm’s stressed acres this season either confirms its placement or flags it for a second look in the next seed decision.

Every application, every field, on one timeline

Underneath the season-level view is a field-by-field timeline of in-season applications. That timeline turns “what did we spray and why” into a tool growers use to manage decisions: which fields carried which pass, what the data said at the time, and whether the outcome and ROI matched the call.

A companion field map does the same thing spatially: color the whole operation by yield against the farm average, by hybrid, by disease rating, or by bushels lost to harvest timing, then click into any single field for the underlying detail. Seeing the season on a timeline and on a map, side by side with the numbers, is what makes cause and effect legible instead of anecdotal.

The bigger capability: the review builds the plan

The biggest addition is this: the LookBack Report explains what happened and carries those findings straight into a plan for the next season, such as seed and hybrid placement, nitrogen timing, fertilizer, herbicide and fungicide programs, and harvest timing, with the cost and expected revenue of each recommended change. A grower and their advisor can see not just that a change is recommended, but what it costs, what it’s worth, and how that compares to staying the course.

The LookBack Report closes the loop a static report never could. The plan starts with the evidence, and every recommendation is traceable back to the flag, the field, and the data behind it.

Built for the conversation, not just the file

The LookBack Report is designed to be used with a trusted advisor. Findings stay labeled for what they are, measured on this farm’s own fields, or modeled from trial-based responses applied to this operation’s conditions. That way, the conversation about next season starts from what the data can actually support, and what it can’t.

That’s the point of the capability: put field-documented evidence behind the decisions a grower and their advisor are already weighing, in a form that walks from “here’s what the season did” to “here’s what to do about it” without losing the thread in between.

Frequently asked questions

What is the AGMRI LookBack Report?
An interactive season review built on a full season of AGMRI imagery and field analytics from your farm that shows how each hybrid performed and what each in-season decision was worth and carries those findings into a priced plan for the following season.
How is it different from a yield map or a standard season summary?
A yield map shows the outcome. The LookBack Report reconstructs the causes behind it stage by stage: hybrid performance, water and nutrient stress, disease pressure and genetics, harvest timing, and turns each into a specific, dated flag connected to an action, rather than a single end-of-season number.
How does the report evaluate hybrid performance?
It compares how each hybrid or variety performed on wet ground, dry ground, and under disease pressure across this operation's fields. Then it flags where placement should be confirmed or revisited in next year's seed plan.
What's new compared to earlier versions of the report?
The report is now an interactive workspace rather than a static document: a season-long analytics view, a field-and-application timeline, an interactive whole-farm map, a hybrid and variety performance rollup, and the biggest addition: a planning view that turns the season's findings directly into a plan for next year.
Are the findings measured or modeled?
Both, and each is labeled as such throughout the report. Measured findings compare matched groups of the operation's own fields; modeled findings apply trial-based responses to this operation's documented field conditions. The report is explicit about which is which, and where the data isn't strong enough to support a number.
Who is the report meant to be used with?
It's built for a grower and their trusted advisor to review together, walking the season field by field and turning the findings into next year's plan in the same conversation, rather than handing over a report to be read alone.
Can the report help decide where not to spend, not just where to spend?
Yes. Because every recommendation in the plan carries its own cost and expected return, it can show that a pass isn't worth making on a given set of acres as well as it can recommend one.

See what your season can tell you

To learn more about AGMRI and the LookBack Report, request a demo at intelinair.com or contact us at sales@intelinair.com.

Conner Schmidt is the Commercial Lead for Intelinair.

Share This Article

RELATED BLOG POSTS

[pdf-embedder url=”https://www.intelinair.com/wp-content/uploads/2024/10/Topography-Layer.pdf”

Yield Forecast

Understand where your corn yield is based on the current state of the crop. As the season unfolds, see how it is having an impact on your final yield.

Yield Loss

Powered by years of Nitrogen research at the University of Missouri, our corn Yield Loss analytic, powered by NVision Ag, gives insight into potential yield loss due to Nitrogen deficiency. Optional analytic for nitrogen management.

Variable Dry Down

variable dry down

Understand which fields and which areas of the field are drying down to help plan your harvest logistics.

Underperforming Area

low crop health

Not all areas of your fields perform the same and low NDVI doesn’t necessarily mean there is anything you can do to fix it this year. Underperforming Area alerts you to the fields and areas of the fields that are performing below their historical potential. This will allow you to quickly find those fields and areas and make adjustments to get them back on target and protect yield.

Nutrient Deficiency

nutrient deficiency

As the crop grows, it can tell us more of what is wrong with it. This analytic finds the fields and areas of the fields where there is a nutrient deficiency so that issues can be addressed before grain fill.

Disease Stress

disease risk

In conjunction with the Thermal Stress, Disease Stress alert takes into account weather information to more precisely indicate the type of stress impacting the crop.

Thermal Stress

thermal risk

Using our thermal imagery, AGMRI can detect elevated heat patterns of the crop that indicate crop stress.

Crop Health

Crop Health

Get a complete view of your farms and fields and identify where yield potential is ranked highest to the lowest.

Weed Map & Weed Escape

weed escape

Know what fields and areas of the fields have weeds. With machine integration or based on planting date, be alerted to what fields have weeds that may be impacting yield.

Historical Field Performance

AGMRI creates 5 performance zones in each field based on the historical average of those zones. This data is used to compare the current season to help understand where you are underperforming from the zone potential.

Low Emergence

low emergence

Notification of what fields and areas of the field have poor emergence.

Stand Assessment

strand assessment

AGMRI detects the established rows and uses computer vision and machine learning to determine the best segment of row and compares the rest of the field to that segment to give you a relative map. If machine data is integrated, a stand population map is returned.

YOUR MESSAGE WAS SENT SUCCESSFULLY!

dots-horizontal

We have received your inquiry and we’ll be in touch with you soon. 

Thank you for contacting us.