Time-saving features provide confidence in in-season recommendations
INDIANAPOLIS – April 5, 2022 – Intelinair, the maker of AGMRI®, announced the launch of AGMRI Enterprise today, a new service that has been designed specifically with ag retail customers in mind. AGMRI Enterprise provides a current, aggregated view of what is happening in customer fields with regularly scheduled flights throughout the season. In addition, the platform provides retailers the potential to see what is happening in a retailer’s overall geographic area.
“Through AGMRI Enterprise, we are honing in on real-time alerts to save retailers time, but also provide them the confidence they need in making recommendations to their customers,” says Kevin Krieg, Director of Product Marketing for Intelinair. “Our retail customers will be able to elevate their management recommendations with a clear understanding of what is happening in individual fields, earlier than ever before, and gain aggregate insights for their region throughout the growing season.”
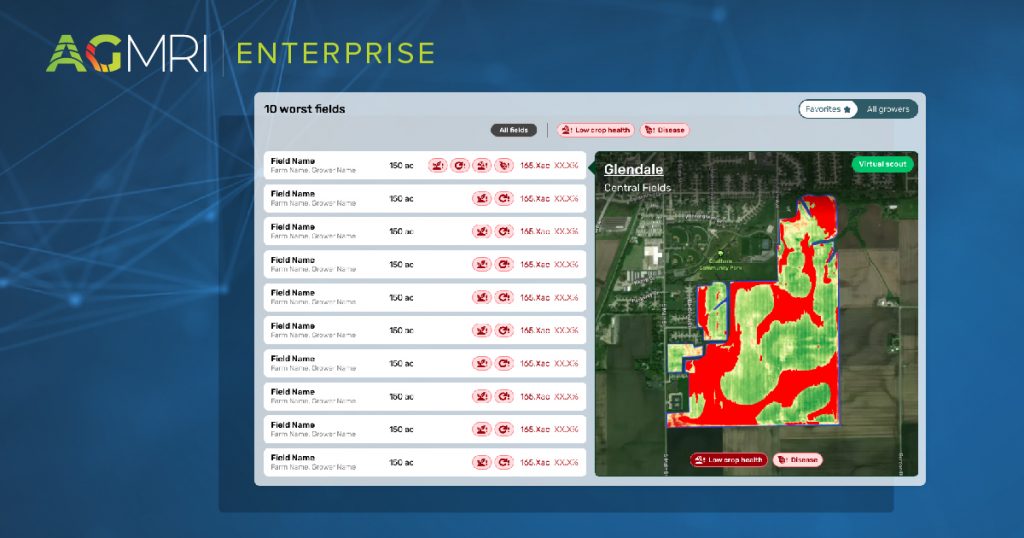
Available via Webapp and iPhone app, new features included with the AGMRI Enterprise services are a Dashboard and a Virtual Scout.
- Dashboard – Provides retailers quick access to what is happening in all customer fields and an understanding of the worst fields through a holistic view of all challenges and with a view specifically for weed pressure, emergence, yield risk and nutrient deficiency.
- Virtual Scout – Offers retailers a bird’s-eye view of the field, but with the ability to see issues before the naked eye can spot them, giving their customers an opportunity to address an issue before it becomes a problem.
“We provide the ability for retailers to know big-picture what is happening in a field and then narrow down specific locations within that field to scout if an area raises an alert through a flight,” says Krieg. “It’s the ‘trust but verify’ situation. Retailers are the agronomy experts; we are giving them a tool to increase their ability to detect issues and provide direct communication to their customers about what they are seeing or not seeing within a field.”
The AGMRI and AGMRI Enterprise platforms work with either in-season satellite imagery or aerial imagery. Satellite imagery is offered in the U.S. and Canada, while aerial imagery is offered in select counties in Illinois and Indiana, with expansion planned for future growing seasons. To learn more about AGMRI and how it helps retailers and farmers elevate their management decisions, visit AGMRI.com.
Download a pdf of the release.
About Intelinair
IntelinAir, Inc. is an automated crop intelligence company that leverages AI and machine learning to model crop performance and identify problems enabling farmers to make improved decisions. The company’s flagship product, AGMRI® aggregates and analyzes data including high resolution aerial, satellite, and drone imagery, equipment, weather, scouting, and more to deliver actionable Smart Alerts on specific problems in areas of fields as push notifications to farmers’ smartphones. The proactive alerts on operational issues allow farmers to intervene, rescue yield, capture learnings for the next season, and identify conservation opportunities for sustainable farming. Annually Intelinair analyzes millions of acres of farmland, helping growers make thousands of decisions for improved operations and profitability.
For more information, follow Intelinair on LinkedIn, Facebook, Twitter, and Instagram and visit agmri.com.
®Trademark of IntelinAir, Inc.