dots-horizontal

Intelinair Drone Technology Used in Beck’s 2023 Replant Study

🌱 Exciting Insights from Beck’s 2023 Precision Farming Research (PRF) offers compelling results on variable rate replanting for soybeans. Drone technology from Intelinair was used to take stand counts for the 2023 replant study. Here’s the scoop:
 

 🔍 Study Findings: 

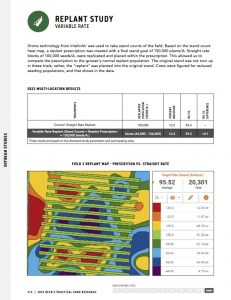
Based on the stand count heat map of an Illinois soybean field, a replant prescription was created with a final stand goal of 150,000 plants/A. Straight rate blocks of 100,000 seeds/A were replicated and placed within the prescription. This allowed them to compare the prescription to the grower’s normal replant population. Variable replant rates ranged from 44,000 to 136,000 seeds/acre, tailored to initial stand counts. 

Minor yield differences were observed, but certain rates showed notable improvements. Overall, the variable rate area had ~2.5% higher yield and ~4.5% less seed was used as compared to the 100,000 seed/acre blocks. 

Data-driven decisions in replanting can lead to better resource utilization and cost savings.

Review the entire 2023 PRF Book and this replant study variable rate on page 214.


About IntelinAir, Inc.

IntelinAir, Inc. provides whole-field insights all season long to farmers and ag retailers through its easy-to-use interactive platform, AGMRI. Through AGMRI Insights and AGMRI Analyze, Intelinair’s proven data analytics capabilities tracks every acre, every factor – emergence & population impacts, nutrient utilization, hybrid and variety performance, and even weather impact – for data-driven in season and postseason decision making and identifies sustainability opportunities. For more information, follow IntelinAir on LinkedIn, Facebook, Twitter, and Instagram, and visit intelinair.com.

®Trademark of IntelinAir, Inc.

Share This Article

RELATED BLOG POSTS

Yield Forecast

Understand where your corn yield is based on the current state of the crop. As the season unfolds, see how it is having an impact on your final yield.

Yield Loss

Powered by years of Nitrogen research at the University of Missouri, our corn Yield Loss analytic, powered by NVision Ag, gives insight into potential yield loss due to Nitrogen deficiency. Optional analytic for nitrogen management.

Variable Dry Down

variable dry down

Understand which fields and which areas of the field are drying down to help plan your harvest logistics.

Underperforming Area

low crop health

Not all areas of your fields perform the same and low NDVI doesn’t necessarily mean there is anything you can do to fix it this year. Underperforming Area alerts you to the fields and areas of the fields that are performing below their historical potential. This will allow you to quickly find those fields and areas and make adjustments to get them back on target and protect yield.

Nutrient Deficiency

nutrient deficiency

As the crop grows, it can tell us more of what is wrong with it. This analytic finds the fields and areas of the fields where there is a nutrient deficiency so that issues can be addressed before grain fill.

Disease Stress

disease risk

In conjunction with the Thermal Stress, Disease Stress alert takes into account weather information to more precisely indicate the type of stress impacting the crop.

Thermal Stress

thermal risk

Using our thermal imagery, AGMRI can detect elevated heat patterns of the crop that indicate crop stress.

Crop Health

Crop Health

Get a complete view of your farms and fields and identify where yield potential is ranked highest to the lowest.

Weed Map & Weed Escape

weed escape

Know what fields and areas of the fields have weeds. With machine integration or based on planting date, be alerted to what fields have weeds that may be impacting yield.

Historical Field Performance

AGMRI creates 5 performance zones in each field based on the historical average of those zones. This data is used to compare the current season to help understand where you are underperforming from the zone potential.

Low Emergence

low emergence

Notification of what fields and areas of the field have poor emergence.

Stand Assessment

strand assessment

AGMRI detects the established rows and uses computer vision and machine learning to determine the best segment of row and compares the rest of the field to that segment to give you a relative map. If machine data is integrated, a stand population map is returned.