Early detection of disease can lead to profit opportunities for farmers
Indianapolis – June 8, 2022 – Tar Spot took the Corn Belt by storm last year with its widespread infestation. This year farmers will have one more tool at their fingertips to spot disease before it happens, thanks to Intelinair and a newly introduced disease alert.
“We know that with disease, early detection is everything,” says Kevin Krieg, Director of Product Marketing with Intelinair. “Our AGMRI platform now provides an extra set of eyes on the field when it comes to disease detection thanks to our new alert.”
The new disease alert takes into consideration the same conditions agronomists have used for years to watch for disease: precipitation, topography, soil type and emergence – but, with one small addition: plant temperature. That addition makes a world of difference.
“Plants, like humans, show early signs of disease through elevated temperature,” adds Krieg. “Our thermal layers spots that early in a field and flags it for the agronomist or farmer to keep an eye on.”
That thermal layer proved beneficial in July 2021 when AGMRI’s thermal imaging spotted the potential for disease in a central Illinois cornfield days before human eyes would verify a Tar Spot outbreak.
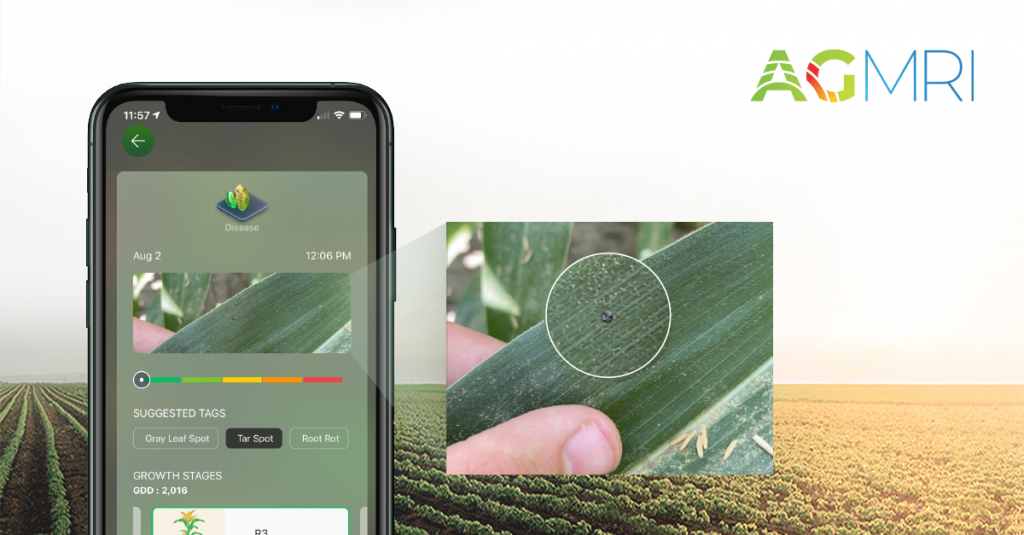
AGMRI provides users a range of layers to compare different factors within a field, along with regular captures throughout the season to identify changes in the field from capture to another. This particular change couldn’t be explained and was flagged for the user.
“The early detection wasn’t meant to tell the grower to spray, but rather watch the field in a specific location,” says Krieg. “Scouting showed nothing early on, but by July 28 the infestation was visible and in the exact location that showed temperature variations earlier in the summer. They were able to treat the disease before it did any more damage or spread throughout the field.”
For those wanting to learn more about what AGMRI brings to in-season management, Intelinair says they are offering a shortened package just for Disease Season 2022.
“We are the early detection leaders and we’re ready to show how our product works,” adds Krieg. “We are offering a shortened, four-capture package to showcase the full capabilities of AGMRI to customers. The package will run from late June to early August, right in the prime of disease season.”
In addition to disease alerts, AGMRI provides early warning alerts for other challenges throughout the season including emergence, weeds, crop health and harvest readiness, along with indicators of nutrient deficiency, disease and replant opportunities.
To find out how you can sign up for this special package before the cutoff of July 1, contact Intelinair at www.agmri.com
About IntelinAir, Inc.
IntelinAir, Inc., is an automated crop intelligence company that leverages AI and machine learning to model crop performance and identify problems enabling farmers to make improved decisions. The company’s flagship product, AGMRI® aggregates and analyzes data including high resolution aerial, satellite, and drone imagery, equipment, weather, scouting, and more to deliver actionable Smart Alerts on specific problems in areas of fields as push notifications to farmers’ smartphones. The proactive alerts on operational issues allow farmers to intervene, rescue yield, capture learnings for the next season, and identify conservation opportunities for sustainable farming. Annually Intelinair analyzes millions of acres of farmland, helping growers make thousands of decisions for improved operations and profitability. Follow Intelinair on LinkedIn, Facebook, Twitter, and Instagram and visit intelinair.com or AGMRI.com.
®Trademark of IntelinAir, Inc.