Use Case: How Early Tar Spot Detection Turned a Wait-and-See Fungicide Call Into a Targeted Plan
Published: September 30, 2026
By: Blake Retherford
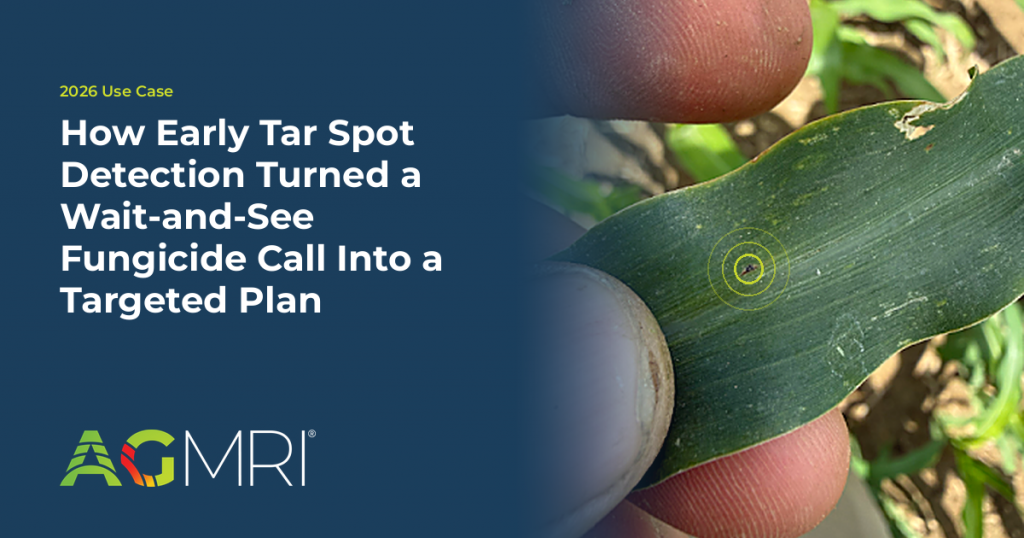
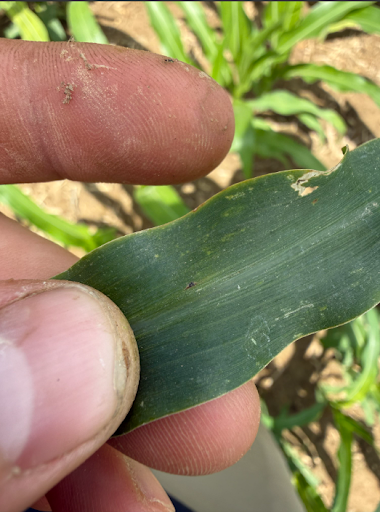
For growers on a two-pass fungicide program, the hardest call of the season is often the second one: spray now, or wait until you see disease? In 2026, one Indiana corn grower answered that question with data from his own fields and treated four of his six fields at V8, well ahead of tar spot.An early tar spot lesion in the field: small and easy to miss on a single leaf, and the ground-truth that confirmed risk had become reality.
The situation: a skipped V5 pass and an unusual weather year
This grower did not make a V5 fungicide application this season. His V5 Fungicide Opportunity Report in AGMRI flagged that decision as worth a second look. It showed more than $16,000 in potential return across his fields if he treated the right acres.
Tar spot is a recurring concern in his region. Like many two-pass growers, he wanted to wait for visible disease pressure before committing fungicide dollars. But 2026 weather was anything but ordinary, and those are exactly the conditions that can speed disease spread once it takes hold.
The challenge: tar spot is hard to catch early
With higher input prices, blanket fungicide applications can be inefficient. Even with a V5 report showing strong ROI potential, this grower wanted his decision grounded in current disease pressure, not a spreadsheet alone.
That is a familiar bind. Tar spot’s first signs are tiny lesions that are easy to miss in the canopy. Once that first lesion shows up, the weather dictates how fast it spreads. In an unusual year, waiting for confirmation can mean acting too late and leaving yield on the table across multiple fields.
The solution: whether, when, and where
Predictive Disease answered whether and when. AGMRI’s Predictive Disease found tar spot in one of his fields about a week after Indiana’s first confirmed case of the season, and before any confirmed case in his county. The field card showed the risk level and a defined action window before disease was visible across the field.
The Predictive Disease field card for the flagged field: risk level and a defined action window pointed the decision before disease was visible.
That changed the decision. Instead of waiting for tassel, he made a fungicide pass at V8. It was earlier than usual for him, but clearly warranted by the risk in his own fields.
The V5 Fungicide Opportunity Report answered where. His highest-opportunity field, at the top of the report’s ranked list, was the same field where tar spot had turned up. Using that ranking, he treated the top four of his six fields, concentrating the pass on the acres with the most return potential instead of treating everything or guessing.
The V5 Fungicide Opportunity Report, with the flagged field at the top of the ranked list, used to decide which fields to treat.
The results
$16,000+ in ranked return potential targeted with his fungicide dollars
4 of 6 fields treated, prioritized by ROI
V8 application, ahead of tassel, based on predicted risk
By pairing early detection with field-level ROI ranking, he acted ahead of the disease instead of chasing it, and prioritized the right fields during a busy stretch.
What this means for your 2027 fungicide plan
The grower made the call. AGMRI gave him the field-level evidence to make it with confidence. Looking ahead, he plans to lean on AGMRI to time and target future passes, so the V5 decision is data-backed from the start.
AGMRI Predictive Disease flags field-level disease risk and an action window, which can help growers and agronomists catch tar spot before it is widespread in the canopy.
What is the V5 Fungicide Opportunity Report?
It is an AGMRI report that estimates fungicide return potential and ranks fields, so growers can decide which acres to treat first.
Can I use AGMRI on a two-pass fungicide program?
Yes. In this 2026 use case, a two-pass grower used Predictive Disease to time his second pass at V8 and the V5 report to choose which four of six fields to treat.
Understand where your corn yield is based on the current state of the crop. As the season unfolds, see how it is having an impact on your final yield.
Yield Loss
Powered by years of Nitrogen research at the University of Missouri, our corn Yield Loss analytic, powered by NVision Ag, gives insight into potential yield loss due to Nitrogen deficiency. Optional analytic for nitrogen management.
Variable Dry Down
Understand which fields and which areas of the field are drying down to help plan your harvest logistics.
Underperforming Area
Not all areas of your fields perform the same and low NDVI doesn’t necessarily mean there is anything you can do to fix it this year. Underperforming Area alerts you to the fields and areas of the fields that are performing below their historical potential. This will allow you to quickly find those fields and areas and make adjustments to get them back on target and protect yield.
Nutrient Deficiency
As the crop grows, it can tell us more of what is wrong with it. This analytic finds the fields and areas of the fields where there is a nutrient deficiency so that issues can be addressed before grain fill.
Disease Stress
In conjunction with the Thermal Stress, Disease Stress alert takes into account weather information to more precisely indicate the type of stress impacting the crop.
Thermal Stress
Using our thermal imagery, AGMRI can detect elevated heat patterns of the crop that indicate crop stress.
Crop Health
Get a complete view of your farms and fields and identify where yield potential is ranked highest to the lowest.
Weed Map & Weed Escape
Know what fields and areas of the fields have weeds. With machine integration or based on planting date, be alerted to what fields have weeds that may be impacting yield.
Historical Field Performance
AGMRI creates 5 performance zones in each field based on the historical average of those zones. This data is used to compare the current season to help understand where you are underperforming from the zone potential.
Low Emergence
Notification of what fields and areas of the field have poor emergence.
Stand Assessment
AGMRI detects the established rows and uses computer vision and machine learning to determine the best segment of row and compares the rest of the field to that segment to give you a relative map. If machine data is integrated, a stand population map is returned.
YOUR MESSAGE WAS SENT SUCCESSFULLY!
We have received your inquiry and we’ll be in touch with you soon.