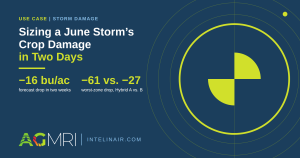

Sizing a June storm’s crop damage in two days, with a 16 bu/ac forecast drop and worst-zone losses of 61 vs. 27 bu/ac by hybrid.
dots-horizontal

Use Case | How Yield Forecast in AGMRI Sized the Loss from a June Storm

Published: October 28, 2026

By: Damon Oien

When a storm hits midseason, growers face the same question: how much did it cost, and where? On one operation this June, AGMRI yield forecast answered it within two days of the storm. One field dropped 16 bu/ac in forecasted yield over two weeks while every other field trended up. The data also showed which of the two hybrids took the wind harder, giving the grower numbers to start an insurance claim and a plan for disease monitoring. Then, flight over flight, it tracked the corn’s recovery as forecasted yield slowly climbed through July.

A strong field in a hard season

This grower farms across a wide geography that saw several strong storms in a single month.

Early saturation forced replanting on many acres, and he spent much of his time evaluating those acres and establishing a solid stand.

This field was different. It was one of his later-planted, higher-performing fields, and it trended positively all year.

The question after the storm

After the high winds passed, the team met with the grower for a midseason review. He suspected one of his top fields had taken wind damage, but he hadn’t verified it. Walking the field would have taken time he didn’t have.

Even a field walk would have left the bigger questions open:

  • How large was the loss?
  • Did one hybrid hold up better than the other?
  • Was there enough evidence to support an insurance claim?

What yield forecast showed

The team pulled the AGMRI yield forecast from recent flights. Every other field in the operation was trending up. This one had fallen 16 bu/ac in forecasted yield over two weeks, with the drop lining up with the storms that hit two days before the review.

Next, the grower wanted to know whether one hybrid held up better than the other. The vegetative analytic layer from the June 12 flight showed one hybrid holding a visibly stronger canopy across the field.
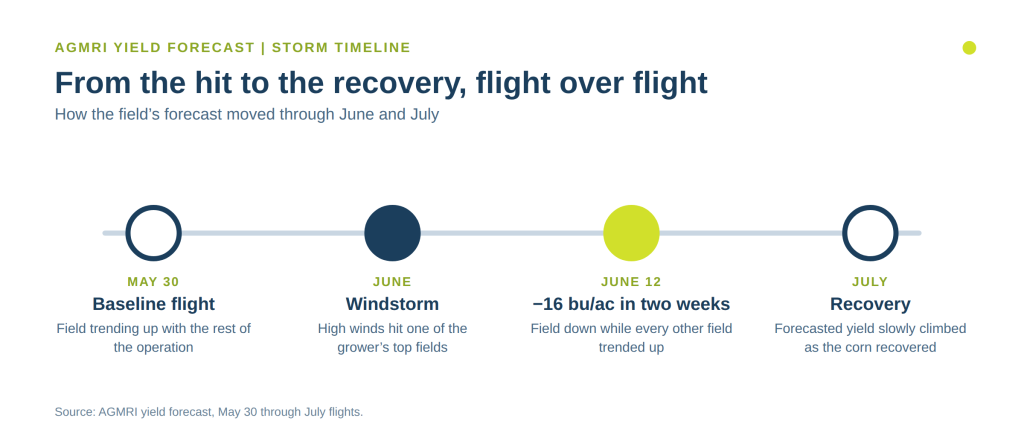
Timeline of AGMRI yield forecast: May 30 baseline, June windstorm, 16 bu/ac drop by June 12, and recovery through July.
The field’s forecast fell 16 bu/ac after the storm, then slowly climbed as the corn recovered.

Comparing hybrids with AGMRI AI Chat
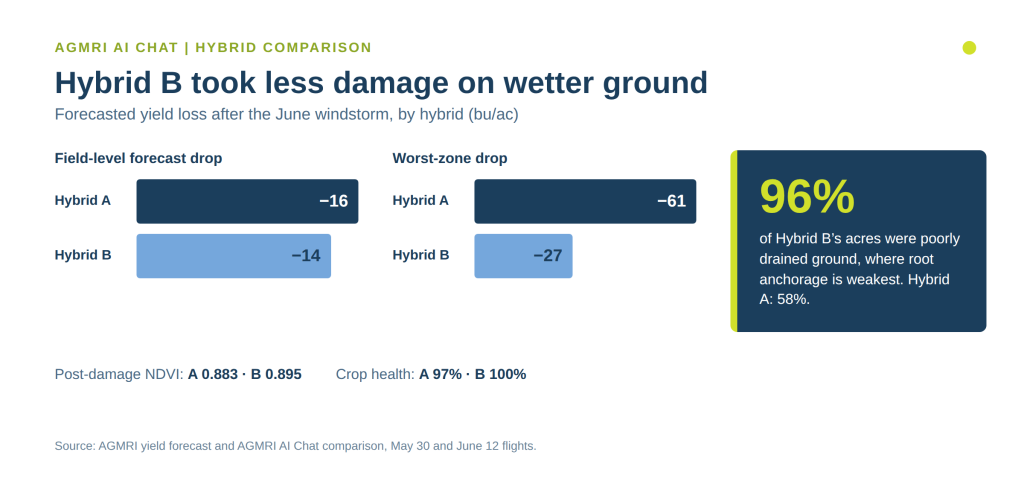
The team then used AGMRI AI Chat to compare the two hybrid environments and see how crop stress and vegetation changed since earlier flights. One hybrid had already fallen behind on that farm and sustained more damage in the high winds.

How each hybrid handled the June windstorm
Measure (after the wind)Hybrid AHybrid B
Yield forecast drop (bu/ac)−16−14
Worst zone drop (bu/ac)−61−27
Post-damage NDVI0.8830.895
Crop health97%100%
Share of acres poorly drained58%96%

Source: AGMRI yield forecast and AGMRI AI Chat comparison, May 30 and June 12 flights.

The drainage figure is the standout. Hybrid B held up better on ground that was 96% poorly drained. Saturated soil weakens root anchorage, yet Hybrid B still outperformed Hybrid A, which sat on better soil.

AGMRI AI Chat hybrid comparison: Hybrid A dropped 16 bu/ac (worst zone −61) and Hybrid B dropped 14 (worst zone −27), on ground that was 96% poorly drained.

The management decisions that followed

The grower made two calls from the data:

  1. Start the insurance claim sooner. He opened claim discussions with field- and hybrid-level numbers in hand, not estimates.
  2. Watch the damaged acres for disease. Plant damage raises disease risk, so he closely monitored this field as the season moved into peak disease pressure.


The hybrid comparison also gave him evidence for hybrid placement on wet ground in future seasons.

Tracking the recovery

The story didn’t end with the initial hit. The corn recovered significantly from the early wind event, and forecasted yield slowly climbed through July.

Tracking that recovery flight-to-flight gave the grower a truer read on what the storm cost than the initial drop alone. That fuller picture informed both the claim discussions and how closely he managed the field for the rest of the season.

Why timing matters

The value here was speed and specificity. The damage was quantified within days of the storm, down to which hybrid took the worst hit, and the recovery was tracked flight over flight, without waiting until harvest. That timing put evidence behind the claim while it was still fresh and pointed scouting time at the acres most at risk.

AGMRI flags where to look and sizes what it finds. The grower and his advisors make the call.

Frequently Asked Questions

Can yield forecast show storm damage before harvest?
Yes. In this case, AGMRI yield forecast showed a 16 bu/ac drop in one field over two weeks, quantifying the impact two days after the storm.
Can aerial imagery compare how hybrids handled wind?
Yes. The vegetative analytic layer showed canopy differences between the two hybrids, and AGMRI AI Chat compared yield forecasts, NDVI, crop health, and drainage for each.
Can yield forecast track how a field recovers after a storm?
Yes. After the initial 16 bu/ac drop, the yield forecast showed the corn recovering significantly, with forecasted yield slowly climbing through July as new flights came in.
How can this data support an insurance claim?
AGMRI gives growers field-level and hybrid-level numbers to bring to claim discussions, helping the insurer and adjuster make claim decisions.
Why monitor storm-damaged fields for disease?
Damaged plants are more vulnerable, so wind damage raises a field’s disease risk heading into peak disease pressure.

Size your next storm’s damage in days, not at harvest

Damon Oien is a territory account manager at Intelinair.

Share This Article

RELATED BLOG POSTS

[pdf-embedder url=”https://www.intelinair.com/wp-content/uploads/2024/10/Topography-Layer.pdf”

Yield Forecast

Understand where your corn yield is based on the current state of the crop. As the season unfolds, see how it is having an impact on your final yield.

Yield Loss

Powered by years of Nitrogen research at the University of Missouri, our corn Yield Loss analytic, powered by NVision Ag, gives insight into potential yield loss due to Nitrogen deficiency. Optional analytic for nitrogen management.

Variable Dry Down

variable dry down

Understand which fields and which areas of the field are drying down to help plan your harvest logistics.

Underperforming Area

low crop health

Not all areas of your fields perform the same and low NDVI doesn’t necessarily mean there is anything you can do to fix it this year. Underperforming Area alerts you to the fields and areas of the fields that are performing below their historical potential. This will allow you to quickly find those fields and areas and make adjustments to get them back on target and protect yield.

Nutrient Deficiency

nutrient deficiency

As the crop grows, it can tell us more of what is wrong with it. This analytic finds the fields and areas of the fields where there is a nutrient deficiency so that issues can be addressed before grain fill.

Disease Stress

disease risk

In conjunction with the Thermal Stress, Disease Stress alert takes into account weather information to more precisely indicate the type of stress impacting the crop.

Thermal Stress

thermal risk

Using our thermal imagery, AGMRI can detect elevated heat patterns of the crop that indicate crop stress.

Crop Health

Crop Health

Get a complete view of your farms and fields and identify where yield potential is ranked highest to the lowest.

Weed Map & Weed Escape

weed escape

Know what fields and areas of the fields have weeds. With machine integration or based on planting date, be alerted to what fields have weeds that may be impacting yield.

Historical Field Performance

AGMRI creates 5 performance zones in each field based on the historical average of those zones. This data is used to compare the current season to help understand where you are underperforming from the zone potential.

Low Emergence

low emergence

Notification of what fields and areas of the field have poor emergence.

Stand Assessment

strand assessment

AGMRI detects the established rows and uses computer vision and machine learning to determine the best segment of row and compares the rest of the field to that segment to give you a relative map. If machine data is integrated, a stand population map is returned.

YOUR MESSAGE WAS SENT SUCCESSFULLY!

dots-horizontal

We have received your inquiry and we’ll be in touch with you soon. 

Thank you for contacting us.